
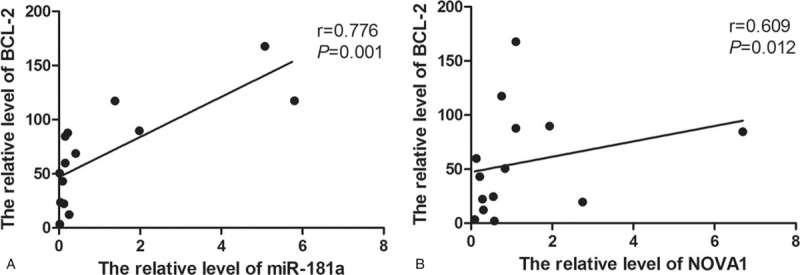
Figure 5.
The relationship between miR-181a and BCL-2, and, between BCL-2 and NOVA1. The spearman correlation analysis was used. (A) The correlation between miR-181a and BCL-2. (B) The correlation between NOVA1 and BCL-2.
Official websites use .gov
A
.gov website belongs to an official
government organization in the United States.
Secure .gov websites use HTTPS
A lock (
) or https:// means you've safely
connected to the .gov website. Share sensitive
information only on official, secure websites.
The relationship between miR-181a and BCL-2, and, between BCL-2 and NOVA1. The spearman correlation analysis was used. (A) The correlation between miR-181a and BCL-2. (B) The correlation between NOVA1 and BCL-2.