Figure 1.

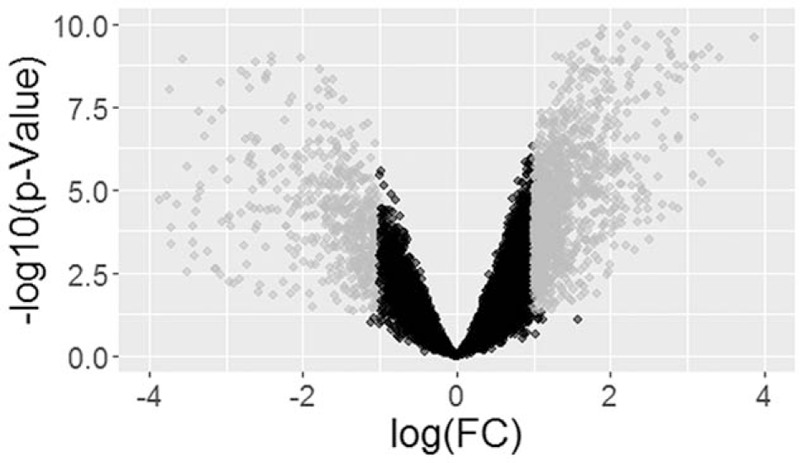
The volcano of differently expressed genes (DEGs). The gray dots represented the significant DEGs with fold change ≤ 2, while black dots indicated nonsignificant DEGs with fold change > 2.

The volcano of differently expressed genes (DEGs). The gray dots represented the significant DEGs with fold change ≤ 2, while black dots indicated nonsignificant DEGs with fold change > 2.