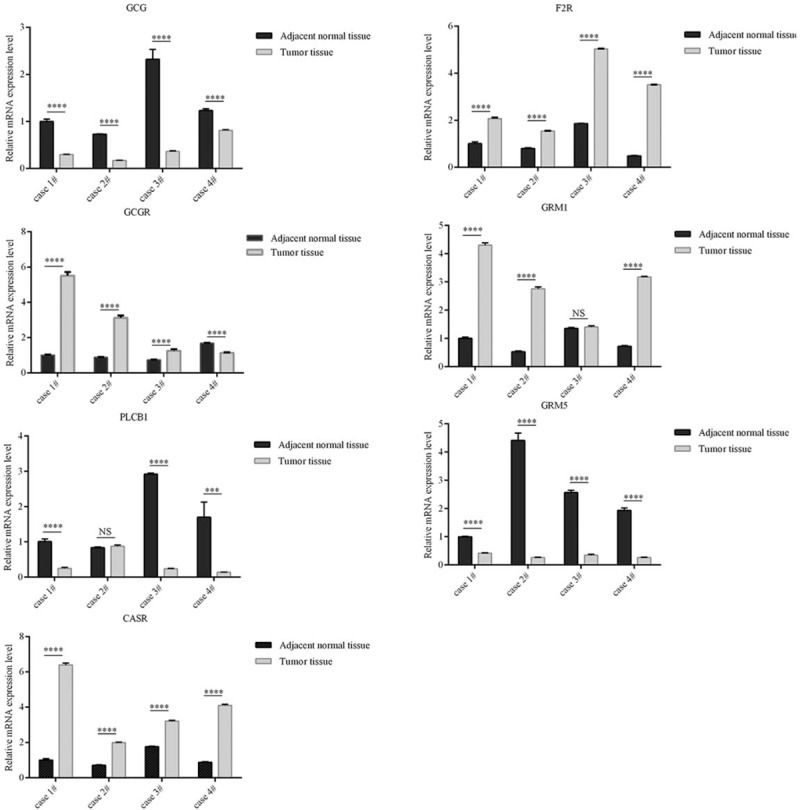
Figure 3.

Quantitative real-time polymerase chain reaction results for 7 identified hub genes. Expression of these DEGs was normalized to ACTB expression. The statistical significance of differences was analyzed by the Student t test. ∗∗∗P < .001, ∗∗∗∗P < .0001. ACTB = beta-actin, DEGs = differently expressed genes, NS = nonsignificance.
