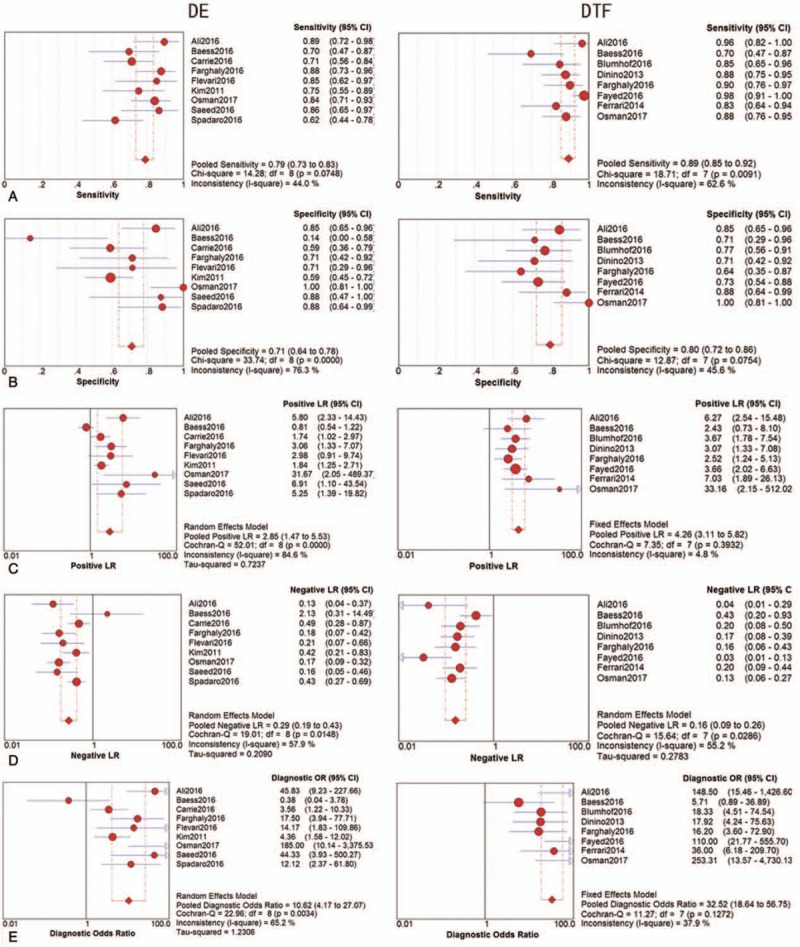
Figure 3.

The diagnostic performance of DE and DTF on weaning outcome: (A) sensitivity, (B) specificity, (C) PLR, (D) NLR, (E) DOR. CI = confidence interval, DE = diaphragm excursion, DOR = diagnostic odds ratio, DTF = diaphragm thickness fraction, NLR = negative likelihood ratio, PLR = positive likelihood ratio.
