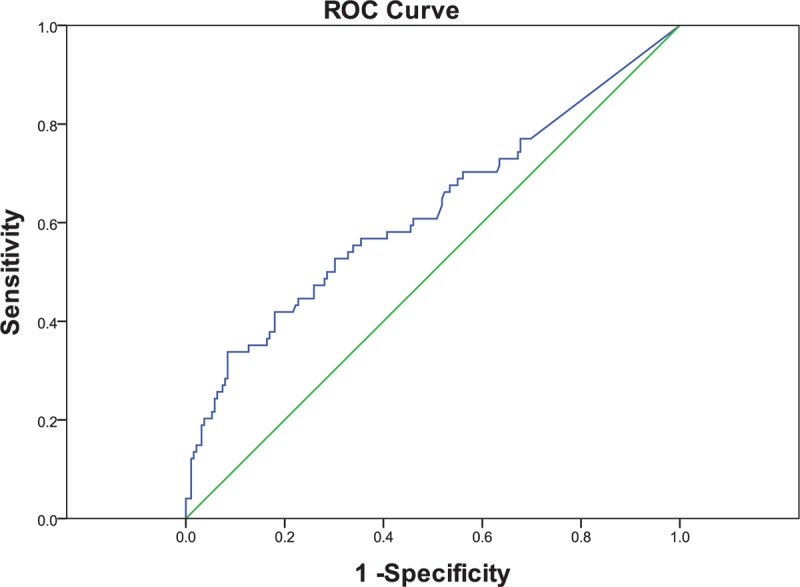
Figure 4.

ROC curves for CR-1 in differentiating the HBV-related HCC and control group. The area under the curve was 0.623. The sensitivity and specificity at the cutoff value of 714.20 pg/mL were 33.80% and 91.50%, respectively. ROC curves = receiver operating characteristics curves, CR-1 = cripto-1, HBV = hepatitis B virus, and HCC = hepatocellular carcinoma.
