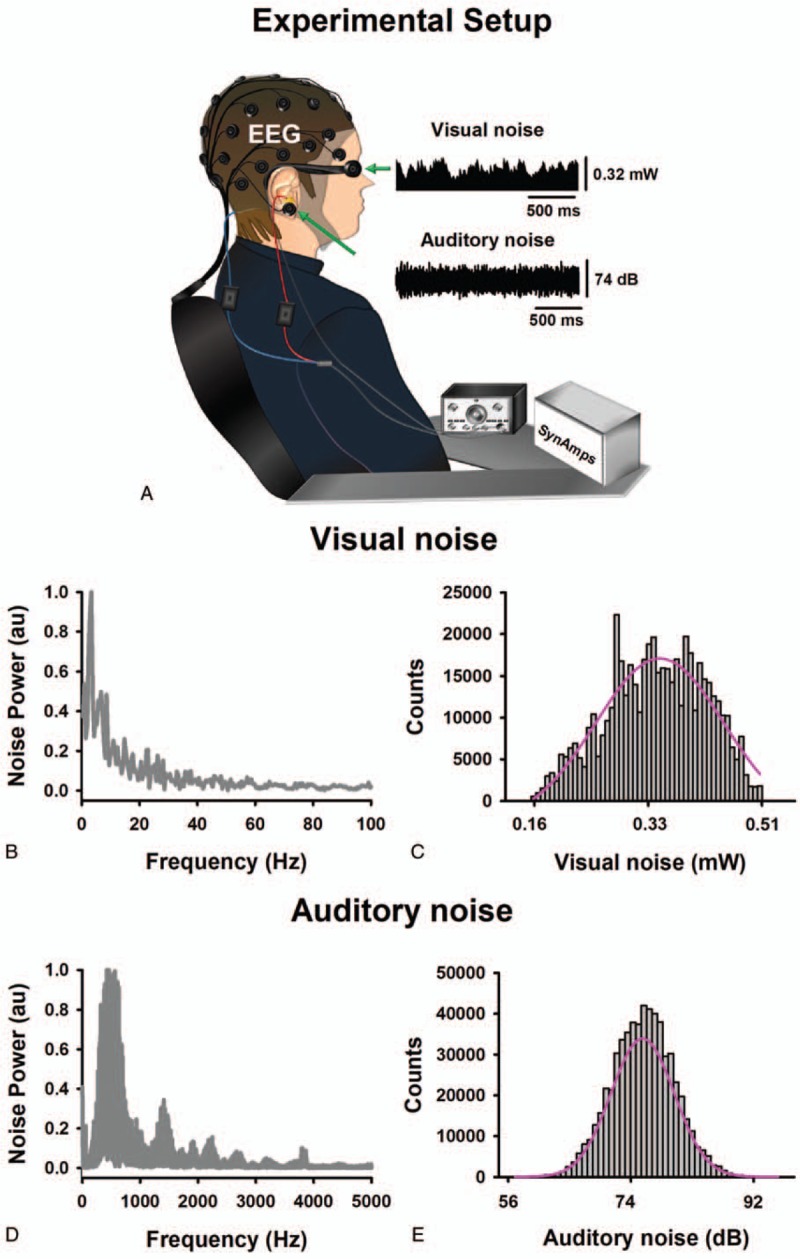
Figure 1.

A: Experimental setup. B: Spectral power of visual noise. C: Histogram of visual noise. D: Spectral power of auditory noise. E: Histogram of auditory noise. These spectra were obtained from the noise recordings detected with light (optical power meter PM100D with analog output and sensor type S150C from Thorlabs) and sound (HER-400 Steren) transducers. Here visual and auditory input noise refers to the noise detected by the transducers. Both types of noise followed a Gaussian quasi-Brownian colored noise profile.
