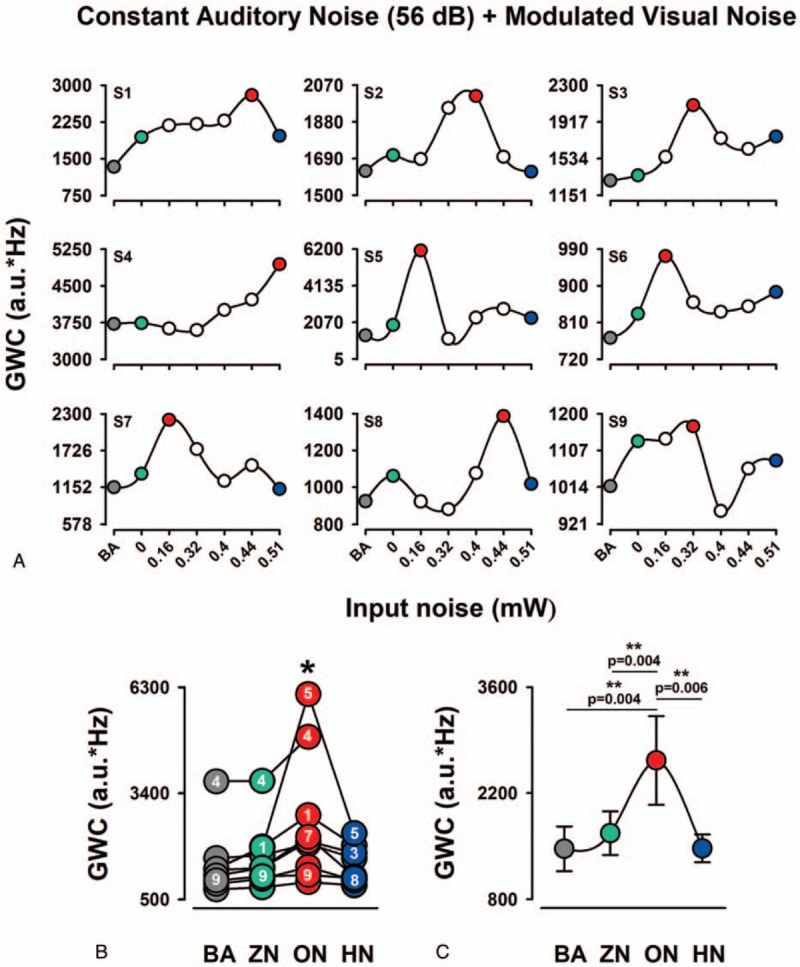
Figure 4.

The occurrence of MISR in the GWC of EEG in the EC2. A: Each graph shows the multisensory stochastic resonance effect on the GWC for the BA and 6 levels of auditory noise and constant visual noise. Note that the GWC is characterized by the inverted U shape for the majority of subjects. B: Pooled data for the value of GWC from all 9 subjects for BA, ZN, ON, and HN. Note the interindividual differences in the GWC values for the noise levels. Numbers inside circles correspond to the subjects. C: Averaged data of GWC. Note the significantly higher amplitude of GWC for ON than for BA, ZN, and HN. BA = , EEG = electroencephalographic, GWC = global weighted coherence, HN = high noise, MISR = multisensory internal stochastic resonance, ON = optimal noise, ZN = zero noise.
