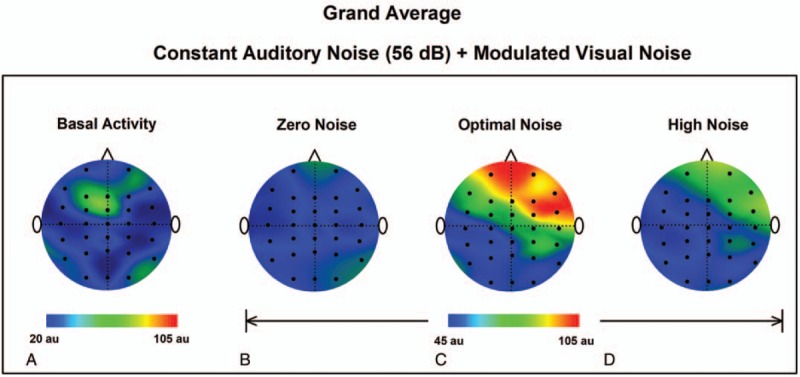
Figure 5.

Topographic maps of the GWC grand-average for the experimental condition 2 for the BA, (A) and 3 visual noise conditions: ZN (B), ON (C), and HN (D). Note that the GWC is higher for ON. BA = basal activity, GWC = global weighted coherence,HN = high noise, ON = optimal noise, ZN = zero noise.
