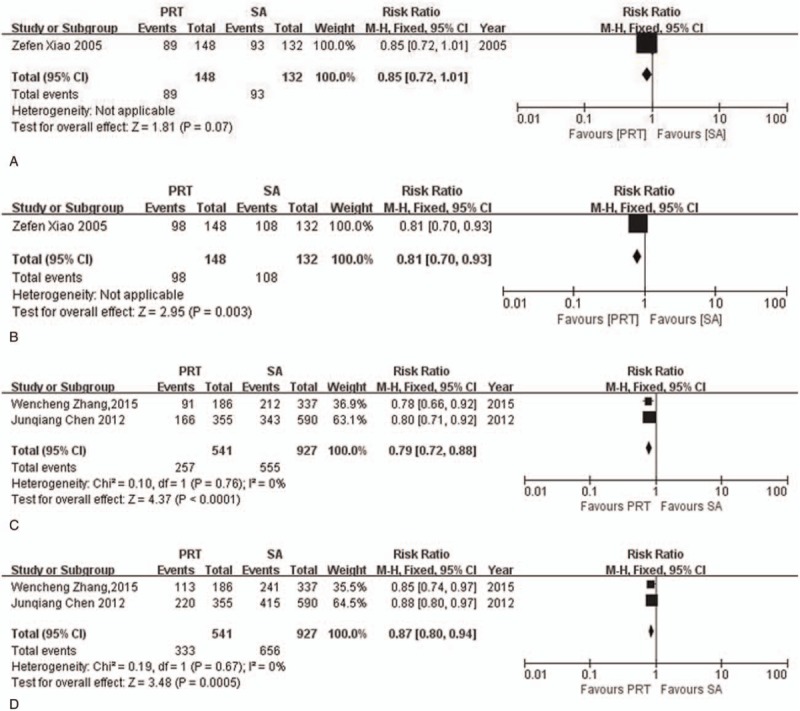
Figure 4.

Forest plot of risk ratio for overall survival rate in pathological lymph node positive (pN+) patients. (A) The polled results for 3-year overall survival rate from randomized-controlled trial; (B) the polled results for 5-year overall survival rate from randomized-controlled trial; (C) the polled results for 3-year overall survival rate from non-randomized-controlled trials; (D) the polled results for 5-year overall survival rate from non-randomized-controlled trials. PRT = postoperative radiotherapy, SA = surgery alone.
