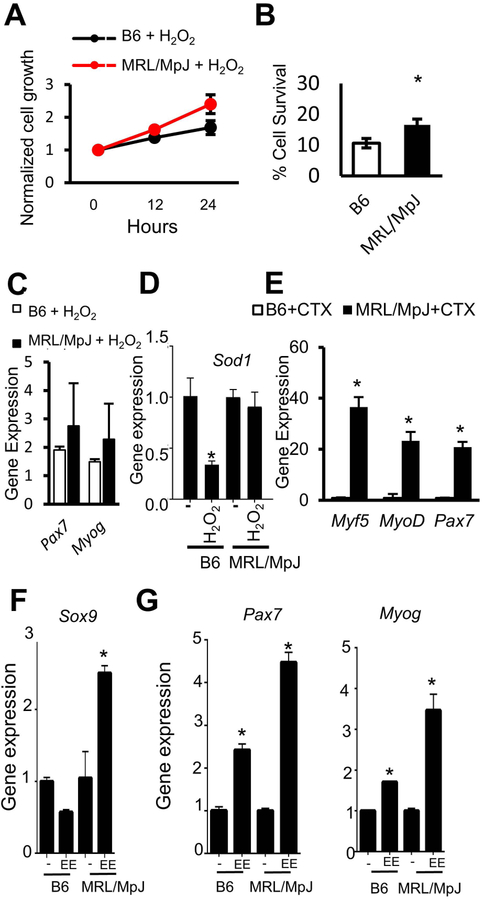
Figure 6. MRL/MpJ MPCs maintain proliferation capacity and potency under stress conditions.
(A) Proliferation rate of B6 MPCs and MRL/MpJ MPCs after treatment with 50 μM hydrogen peroxide (H2O2). (B) Graph bars show the survival ability of B6 MPCs and MRL/MpJ MPCs after treatment with 400 μM of H2O2 for 6 h. (C, D) Quantitative RT-PCR analysis shows levels of gene expression in B6 MPCs and MRL/MpJ MPCs treated with H2O2 for Pax7 and Myog (C) and for Sod1 (D). (E) Quantitative RT-PCR analysis for myogenic gene expression upon CTX-treatment. (F) Quantitative RT-PCR analysis for Sox9 and (G) for myogenic genes after eeyarestatin treatment of B6 and MRL/MpJ MPCs. Error bars indicate mean ± SEM (n=3); P<0.05.

