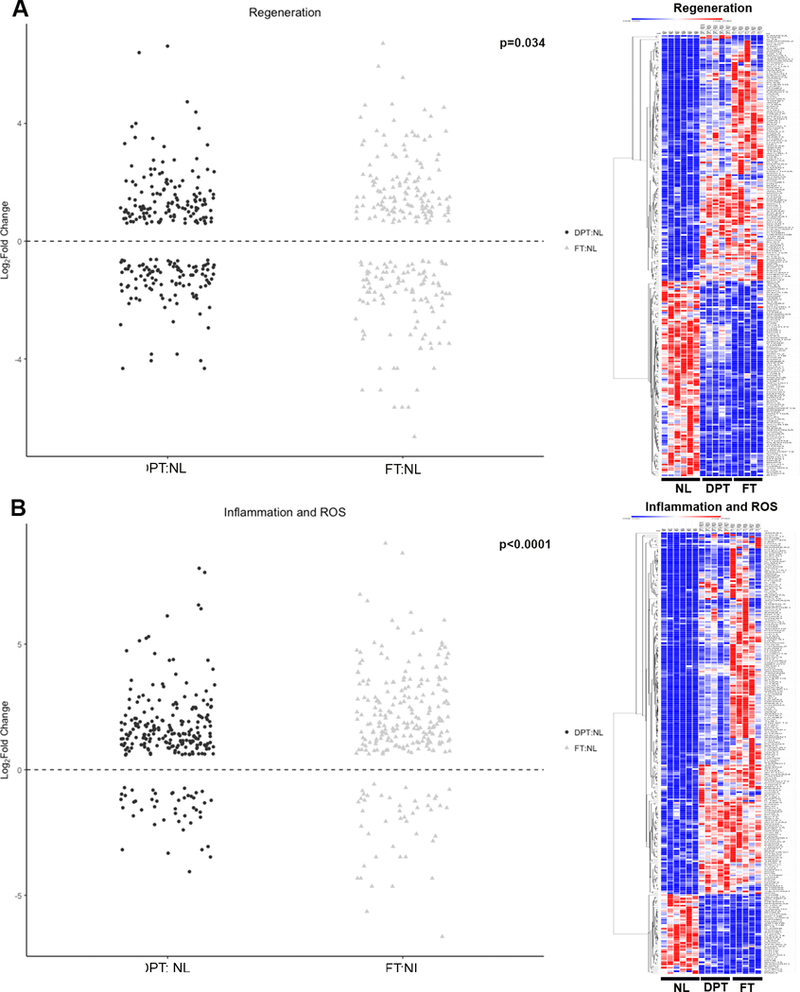
Figure 7 – Analysis of gene sets of genes involved in inflammation of regeneration.

Legend: DPT: Deep partial thickness. FT: Full thickness. NL: Normal tissue. For Jitter plots, each gene is represented with a dot on the Y axis indicating its expression. For the heat maps, each column represents a sample (6 normal, 5 DPT burn and 5 FT burns), while each row represents a single gene. Red indicates greater expression relative to the mean expression of other samples in the same row. Blue indicates lower expression. A) Genes involved in regeneration. Jitter plot and heat map showing that while regenerative genes are overall downregulated relative to normal tissues, DPT had more regenerative capacity than FT tissues. B) Genes involved in inflammation. Jitter plot and heat maps showing that while inflammatory genes are upregulated in both DPT and FT relative to normal tissues, FT had a greater inflammatory gene expression relative to DPT tissues.
