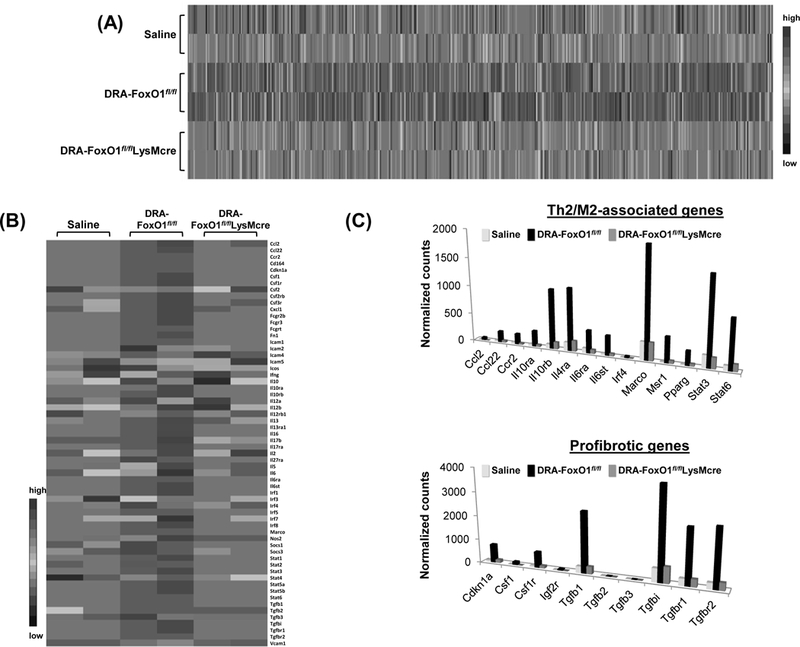
Fig.5. FoxO1 deficient AM express a distinct profile of immune gene in response to DRA.

(A) RNA from AM of allergen-challenged mice was subjected to nCounter Nanostring analysis. Gene expression profiles are displayed as a heat map with hierarchical clustering indicated by dendrogram between FoxO1fl/fl and FoxO1fl/flLysMcre. (B) NanoString expression analysis of representative immune genes. (C) Bar graphs show the mean normalized counts of Th2/M2 immune-related and profibrotic mRNAs that are expressed less frequently in FoxO1fl/flLysMcre AM than in FoxO1fl/fl. Data are presented as means ± standard errors of biological duplicates.
