Figure 1:

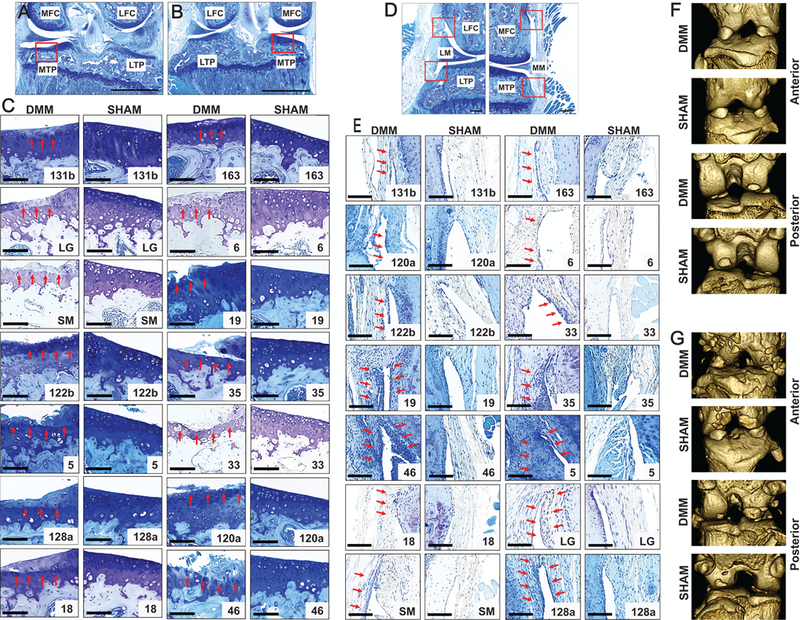
Strain differences in cartilage degeneration, synovitis, and ectopic calcification. Representative images of the area we investigated show cartilage degeneration on the medial tibial plateau in both A) DMM-operated and B) SHAM-operated knees. Representative images (C) showing cartilage degeneration on the medial tibial plateau in various mouse strains (arrows show cartilage degeneration). (D) Synovitis was measured from all four quadrants in a blinded fashion by examining the enlargement of the synovial lining cell layer and density of the cells using previously established scoring system. (E) Representative images showing synovitis among RI strains (arrows show synovitis). Representative micro-CT images of both DMM-operated and SHAM-operated knee joint (F) without ectopic calcification and with (G) ectopic calcification from anterior and posterior view are shown. Scale bar = 100 µm; MFC = medial femoral condyle; LFC = lateral femoral condyle; MTP = medial tibial plateau; LTP = lateral tibial plateau; LM = lateral meniscus; MM = medial meniscus.
