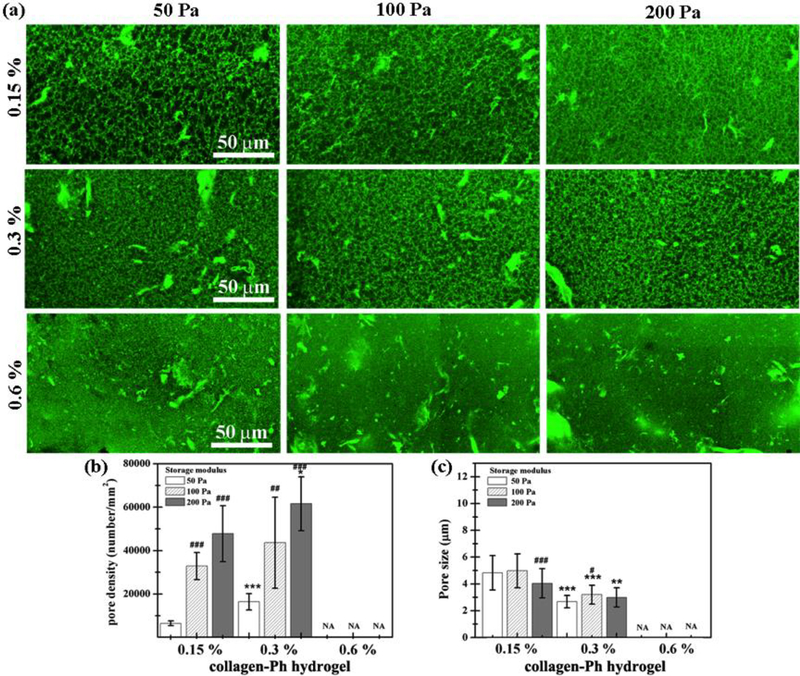
Figure 4.
Collagen-Ph hydrogel microstructure as a function of collagen-Ph concentration and G’. (a) 3D confocal microscopy images and (b-c) summarized data for pore density and pore size are shown. P-values less than 0.01, 0.001 were considered statistically significant and were labeled ** and *** compared with the 0.15 % collagen-Ph hydrogel with the same G’. P-values less than 0.1, 0.01, 0.001 were considered statistically significant and were labeled #, ##, and ###, respectively compared with the collagen-Ph hydrogel with G’ of 50 Pa at the same concentration.

