
Figure 3.
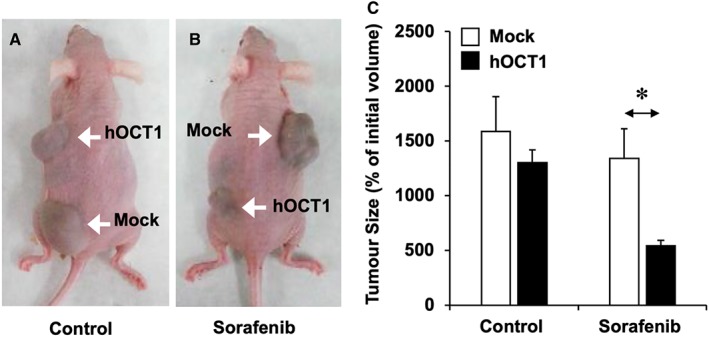
(A–B) Representative images of mice bearing tumours formed after s.c. implantation of ≈107 HepG2 cells transduced with lentiviral vectors either empty (Mock) or containing hOCT1 ORF. Three weeks later, the animals were randomly divided into two groups of five animals each. Control group (A, n = 4 for both types of tumours because one of the animals died during the experimental period) received only the vehicle (saline), whereas the sorafenib group received this drug (10 mg·kg−1 b.w., i.p.) three times per week for 4 weeks (B, n = 5 for both types of tumours). (C) Tumour size was measured at the end of treatment after killing the animals. Values are mean ± SEM. *P < 0.05, upon comparing Mock versus hOCT1 in mice treated with sorafenib.