Figure 4.

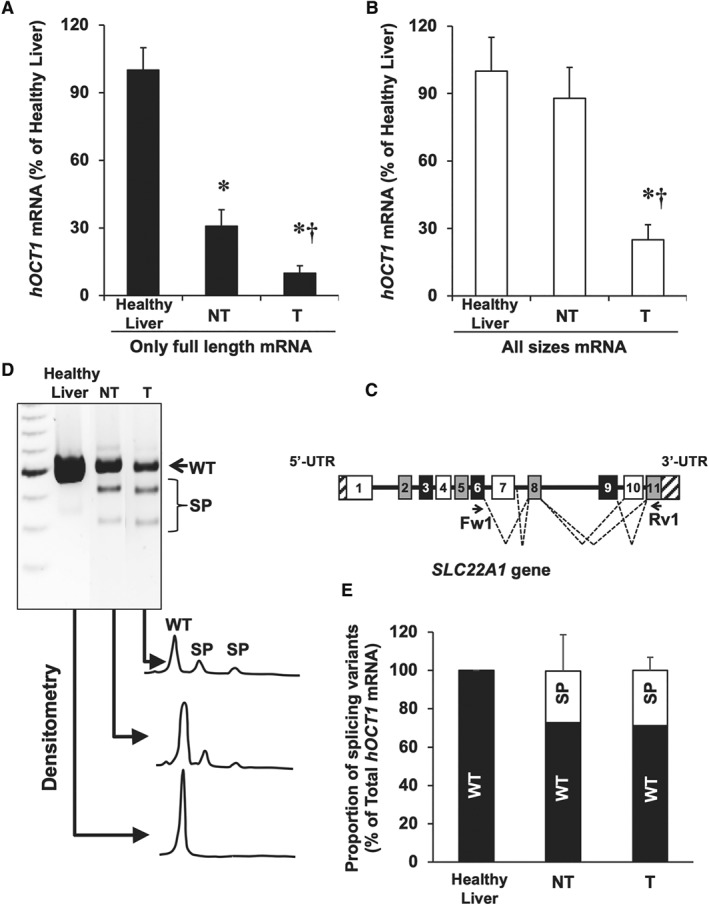
Analysis of hOCT1 mRNA splicing in HCC. Using RT‐qPCR with appropriate primers, the abundance of (A) only the full‐length sequence and (B) total mRNA (full length plus splicing variants) was determined in healthy liver (Control) and in paired samples of T and adjacent NT tissue (n = 19). (C) Structure of exons (boxes), introns (horizontal lines) and UTRs (striped bar) of SLC22A1 pre‐mRNA. Dashed lines indicate exon skipping or intron retention mechanisms of alternative splicing. The location of forward (Fw1) and reverse (Rv1) primers used to detect spliced forms is shown. (D) Representative gel after electrophoresis showing the products of semi‐quantitative RT‐PCR (during the linear phase of the amplification) using cDNA from healthy liver, NT and T samples. (E) Densitometry analysis of relative abundance of wild‐type (WT) versus all splicing variants (SP) of hOCT1. *P < 0.05 as compared with Control; †P < 0.05 as compared with NT.
