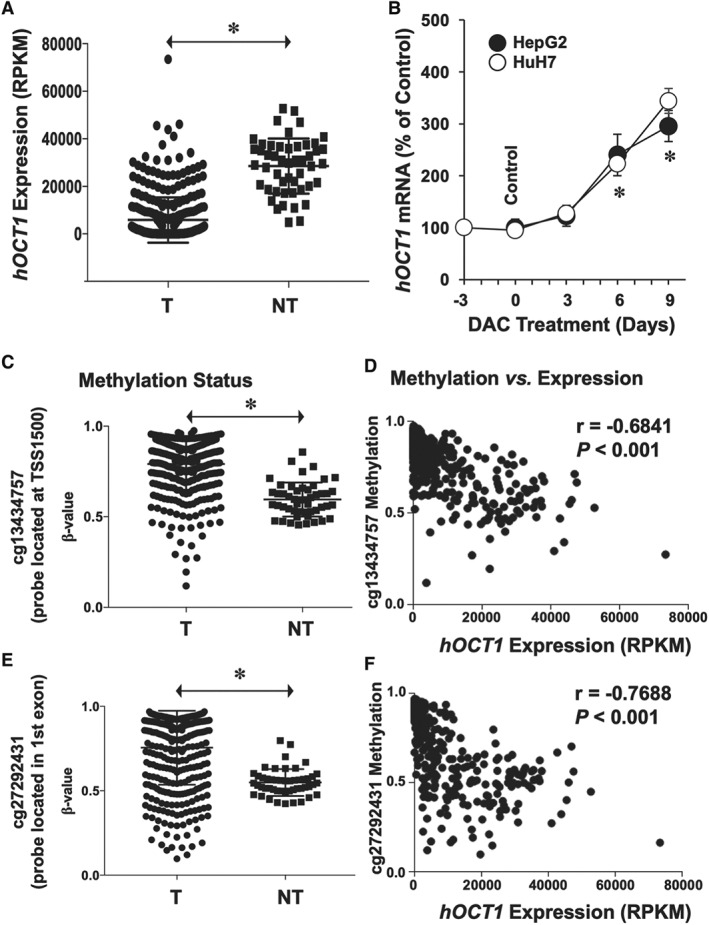
Figure 5.

(A) Expression levels of hOCT1 in T and surrounding NT as determined by transcriptome profiling of HCC. Data were obtained from patients (n = 366) included in the publicly available database TCGA. (B) Effect of treating HepG2 and HuH7 cells with 1 μM of the demethylating agent DAC for the indicated time on hOCT1 expression (mRNA levels). Values (mean ± SEM from five different experiments performed in triplicate) are compared with basal hOCT1 expression in HepG2 and HuH7 cells (Control group, before starting the treatment). *P < 0.05 as compared with Control. (C–F) Methylation status of SLC22A1 gene in HCC (n = 366 from TCGA). Genome‐wide DNA methylation profiling uncovered two critical CpG regions whose methylation status was significantly increased in HCC (C: cg13434757 located at TSS1500 and E: cg27292431 located in exon 1). Relationship between expression levels and methylation status of (D) cg13434757 and (F) cg27292431 regions. Mann–Whitney two‐tailed t‐test was used to compare mean values between groups; *P < 0.05. Spearman's correlation was applied to datasets containing patient‐matched expression and methylation. RPKM, reads per kilobase per million mapped reads.
