Figure 6.

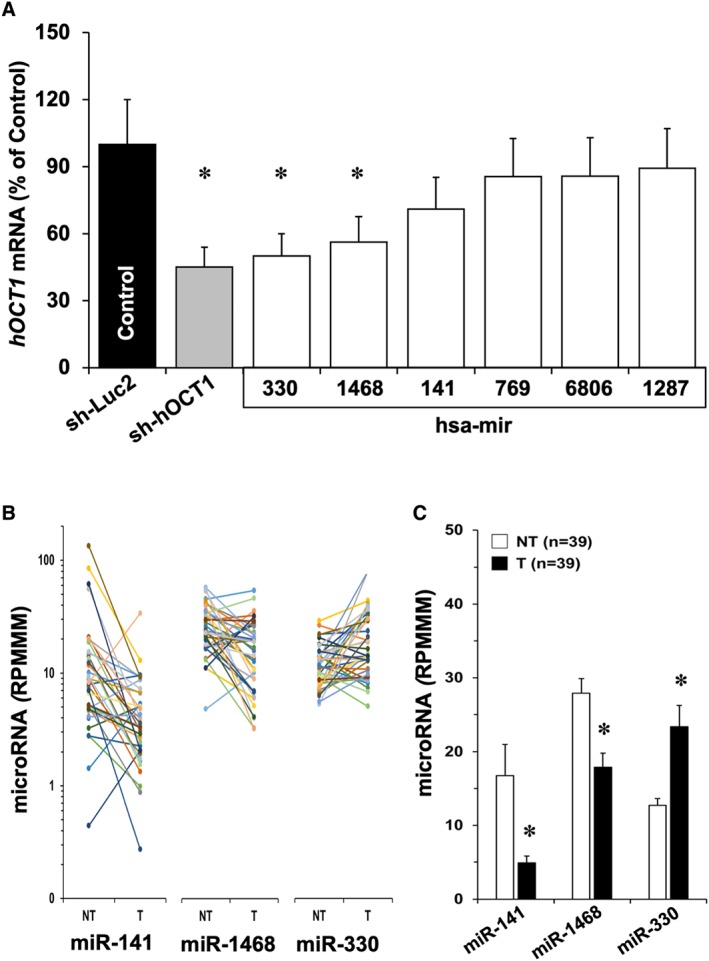
(A) Evaluation of the ability of several miRNAs to inhibit hOCT1 expression in HepG2 cells. The cells were transduced with lentiviral vectors able to induce the expression of sh‐Luc2, used as negative control, or against hOCT1 (sh‐hOCT1), or one of the six miRNAs selected from their expression in HCC and predicted interaction with pre‐mRNA by in silico analysis or reported inhibitory effect on hOCT1 expression. Values are mean ± SEM from five experiments carried out in triplicate. *P < 0.05 on comparing with sh‐Luc2. (B) Individual values of expression levels downloaded from TCGA of miR‐141, miR‐1468 and miR‐330 in 39 paired samples of T and adjacent NT. Results are shown as RPMMM (read per million miRNA mapped). (C) Average values (mean ± SEM) calculated from data shown in B; *P < 0.05 on comparing T and NT by paired t‐test.
