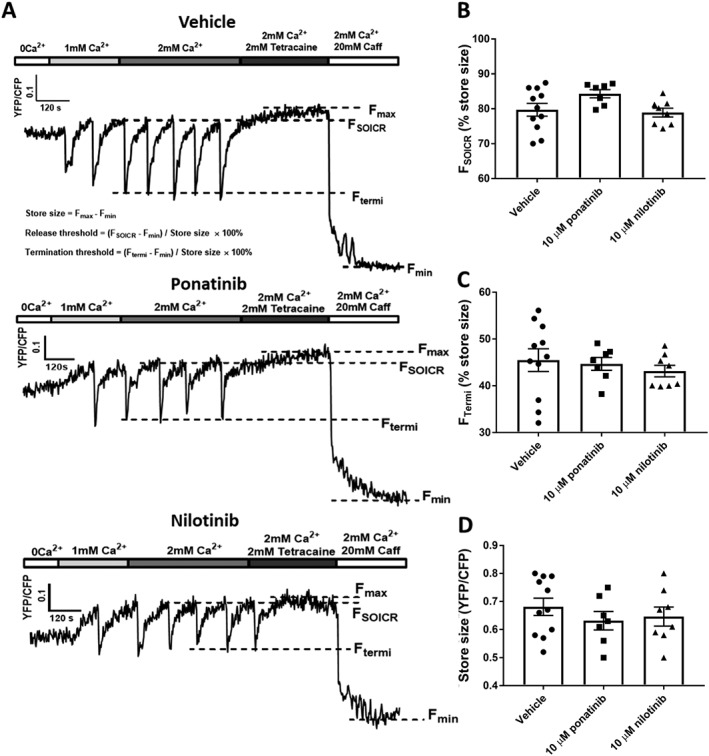
Figure 4.

Effect of class II kinase inhibitors on SOICR dynamics. HEK293 cells stably expressing RyR2 were transfected with the luminally expressed FRET‐based Ca2+ indicator, D1ER. The cells were superfused with KRH containing 1 or 2 mM Ca2+ with or without 10 μM ponatinib or nilotinib. At the end of each experiment, cells were perfused with 2 mM tetracaine and 20 mM caffeine to determine the maximum and minimum store capacities respectively. (A) Representative traces from HEK293 cells treated with vehicle, 10 μM ponatinib or nilotinib. Dashed lines represent the release threshold (FSOICR), termination threshold (FTermi) and maximum (Fmax) and minimum (Fmin) store capacities. Mean ± SEM values of FSOICR, FTermi and store size are shown in panels (B) to (D) and were calculated using the equations shown in the top trace of panel A. n = 11, 8 and 7 independent experiments for vehicle, ponatinib and nilotinib respectively.
