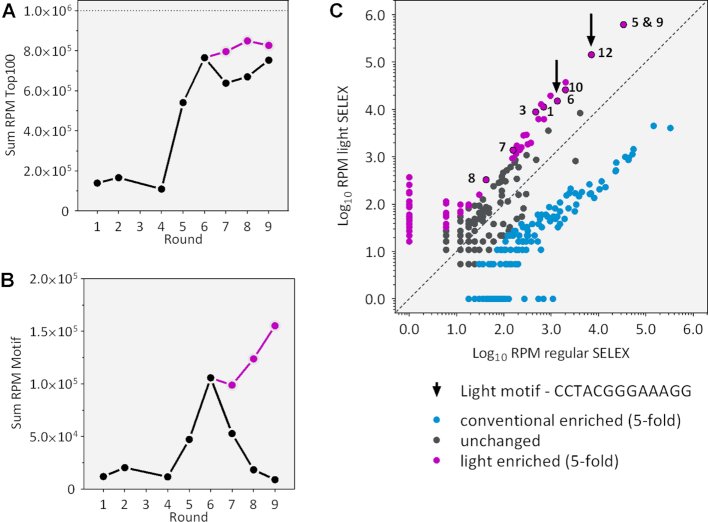
Figure 4.
Deep sequencing analysis of all rounds of selection. (A) Enrichment of the 100 most enriched sequences in each round. Shown is the sum of the RPM in black for traditional SELEX and in violet for light SELEX. (B) Occurrence of the identified light motif within each selection round clearly shows an enrichment in the light SELEX compared to the regular SELEX. (C) Scatter plot of the families found in the regular and the light SELEX. Application of light clearly sets some families apart (at least 5-fold enriched). Analysed families are marked with numbers.

