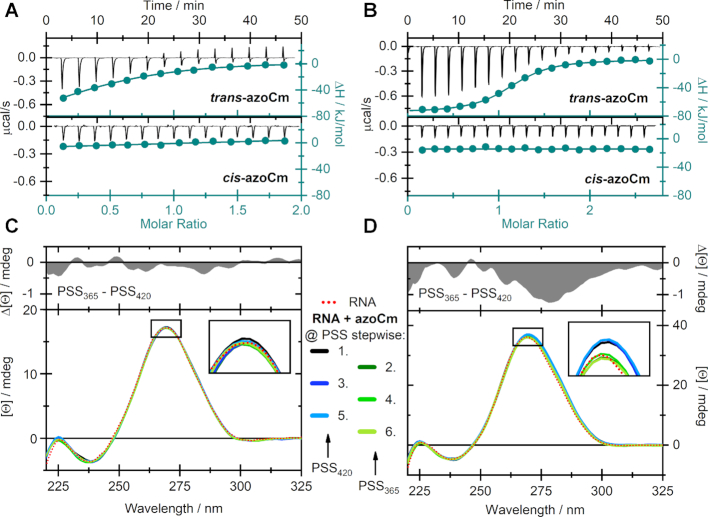
Figure 7.
Biochemical characterization of light-responsive aptamers. ITC measurements of (A) 42 and (B) B2–1 with both the trans- (upper panels) and cis-isomer (lower panels) of azoCm. Measurements were performed using MicroCal iTC200 (aptamer 42) or MicroCal PEAQ iTC200 (aptamer B2–1). CD-monitored alternating photoswitching experiments of azoCm in presence of (C) 42 and (D) B2–1 at 40°C. The red dotted line represents the spectra of the pure RNA-aptamers and the solid colored lines indicate the spectra in the PSS while illuminated with either 420 or 365 nm. The upper panels display difference spectra of the aptamers at both PSS. All CD spectra were corrected for the contribution of the corresponding azoCm photoisomers.

