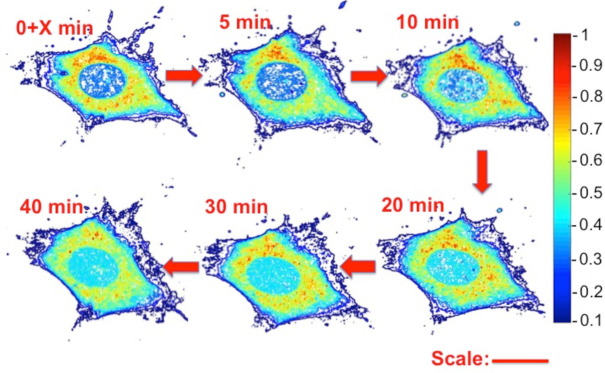
Figure 3.
Surface plots of normalized fluorescent emission intensity distribution from a 0.4 μm-thick confocal slice located at cell's mid-height at various times following rhd-tRNA injection. Full nutrition. The emission intensity was normalized with the maximum intensity in the first image. Similar images from confocal slices at the cell's bottom and top are shown in Supplementary Figure SI–S1. Scale bar: 25 μm. Time is measured after X < 30 s from tRNA injection into the cytoplasm.

