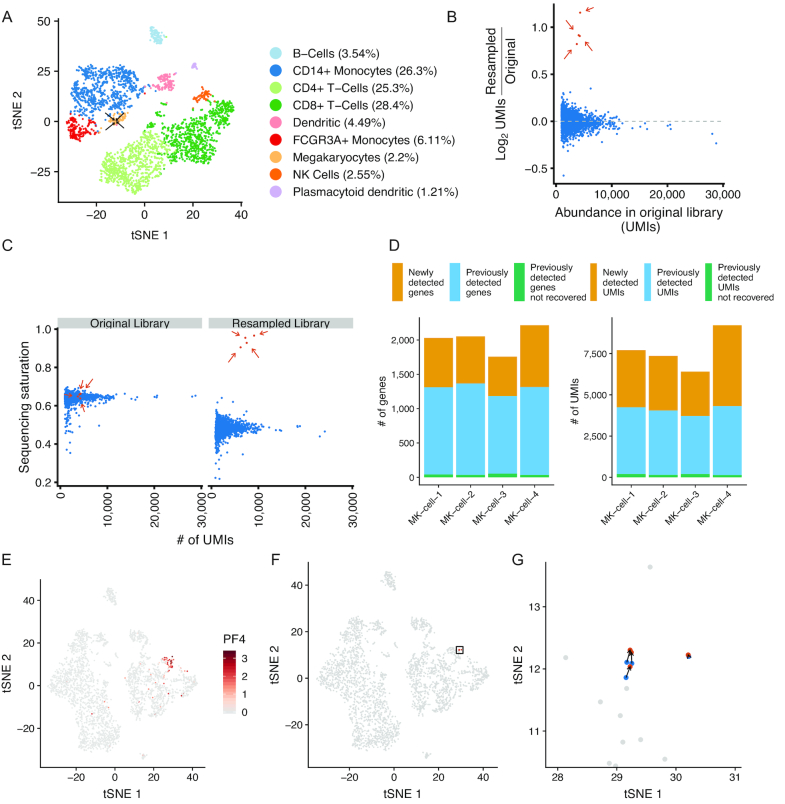
Figure 2.
Resampling rare megakaryocytes from peripheral blood mononuclear cells. (A) tSNE projection of a sample of peripheral blood mononuclear cells (PBMCs; n = 3194 cells) with cells labeled by their inferred cell type. Arrows indicate megakaryocytes selected for resampling (n = 4 resampled megakaryocytes; n = 69 total megakaryocytes). (B) Enrichment of UMIs in targeted cells following resampling. Y-axis indicates log2 enrichment of UMIs normalized by library size of the entire resampled scRNA-seq library. Orange dots and arrows (n = 4) indicate cells selected for resampling; blue dots (n = 3190) are untargeted cells. (C) Sequencing saturation of the targeted cells in the original library and after resampling. Colors are the same as in B. (D) Number of genes or UMIs in the resampled megakaryocyte (MK) cells that are either newly detected in the resampled library (orange), previously detected in the original library (blue), or previously detected in the original library but not found after resampling (green). (E) tSNE projection of the original scRNA-seq dataset supplemented with the resampled cells. Cells are colored by the expression (natural log) of the megakaryocyte marker PF4. (F) tSNE with the original cell transcriptomes (blue), resampled transcriptomes (orange), and non-targeted cells (gray). The rectangle indicates the location of cells highlighted in panel G. (G) tSNE projection of resampled cells in the region highlighted in panel F.

