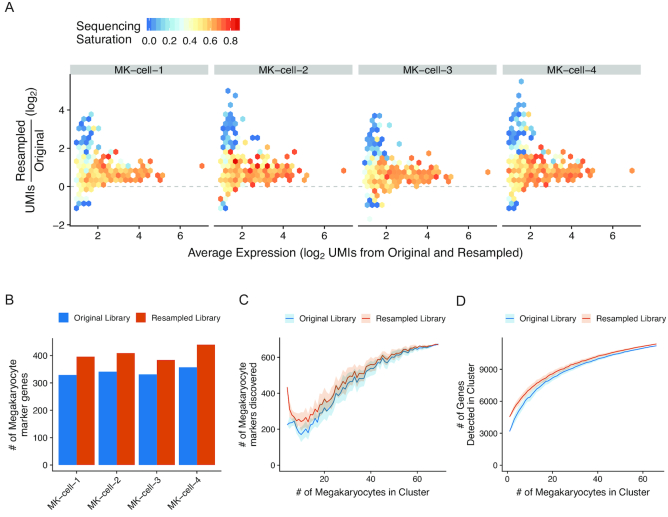
Figure 3.
Enrichment of megakaryocyte markers in resampled cells. (A) Relationship between sequencing saturation and enrichment of genes in the resampled libraries. X-axis indicates the normalized expression as the average of the expression values in the original and resampled libraries. Y-axis indicates UMI enrichment. Genes are binned into hexagons colored by their sequencing saturation (1 – UMIs/reads) calculated from the original library values (scale bar from 0 to 1.0). For genes not detected in the original library, the average sequencing saturation from all megakaryocytes is displayed. (B) The number of genes recovered in each resampled cell that were defined as megakaryocyte markers in the original scRNA-seq dataset. Orange dots are for the resampled libraries; blue is from the original. (C) Markers for megakaryocytes were calculated using the resampled cells (first set of dots), using either the UMI counts from the original library (blue dots) or the UMI counts from the resampled library (orange dots). The same procedure was repeated with increasing numbers of randomly selected non-resampled megakaryocytes supplementing the resampled cells. The random selection was repeated 10 times and the average is shown with the standard deviation displayed in the shaded areas. (D) Number of unique genes detected in a hypothetical megakaryocyte cluster containing the cells selected for resampling from the resampled library (orange line) or the original library (blue line) with increasing numbers of randomly selected non-targeted megakaryocytes supplementing the resampled cells. The random selection was repeated 100 times and the average is shown with the standard deviation displayed in the shaded areas.

