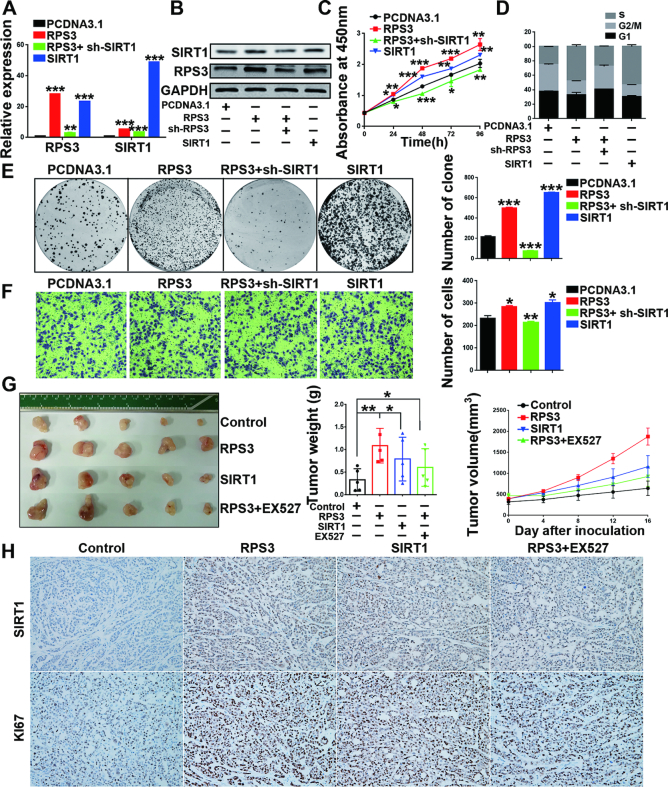
Figure 6.
SIRT1 knockdown rescues the RPS3 overexpression-induced malignant phenotypes of HepG2 cells. (A, B) mRNA and protein levels of RPS3 and SIRT1 in HepG2 cells after different treatments. Cell proliferation (C), cell cycle (D), colony formation (E) and transwell migration (F) assays were performed. (G) Image of the resected subcutaneous tumors from the four groups are shown. Tumor weights and tumor volumes were measured (n = 5). (H) Representative immunohistochemical staining images are shown (magnification, 200×). *P < 0.05, **P < 0.01, and ***P < 0.001.

