Figure 2.
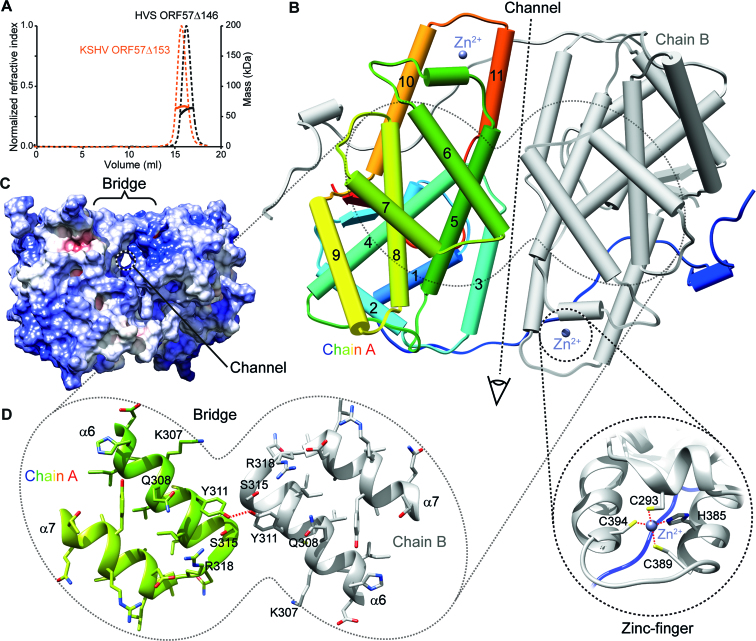
The structure of the C-terminal IHD from HVS ORF57. (A) Analysis of oligomeric state of IHD constructs hvsORF57Δ146 and ksORF57Δ153 by SEC-MALS indicated homo-dimerization. Size-exclusion chromatogram of purified proteins, dashed lines indicate refractive index with scale on left axis, solid lines represent molar mass quantified with scale on right axis. (B) X-ray crystal structure of the hvsORF57Δ146 homo-dimer. Chain A is colored blue through red from N- to C-termini with α-helices labelled and shown as cylinders, while chain B is colored grey. CHCC Zinc-finger locations are indicated by the spheres marked Zn2+ and the lower insert shows detail this feature. (C) Protein surface view colored by electrostatic potential in an orthogonal orientation to panel B, as indicated by eye symbol. A narrow channel through the protein passing under helix α6 is apparent. (D) Detail of helices α6 and α7 that form the homo-dimer bridge feature. Colored as panel A with sidechain atoms shown as sticks; selected residues are labeled. Red dash marks hydrogen bond between the Y311 sidechains.

