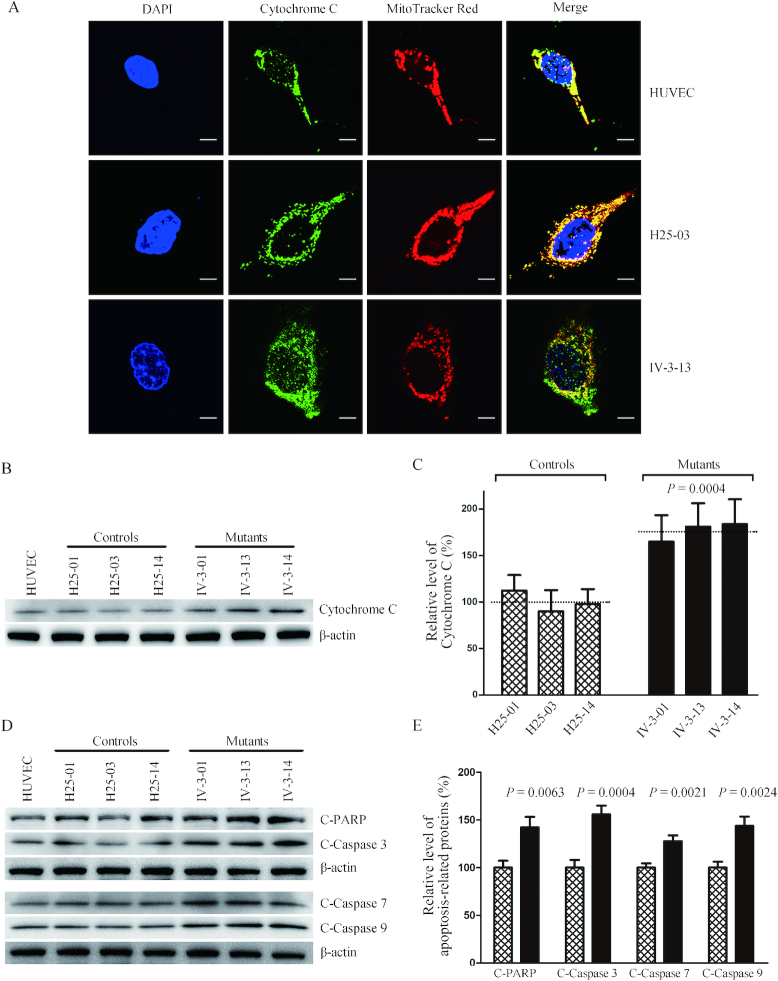
Figure 10.
Analysis of apoptosis. (A) The distributions of cytochrome c from control cybrid cell line (H25-03), mutant cybrid cell line (IV-3-13) and HUVECs were visualized by immunofluorescent labeling with cytochrome c antibody conjugated to Alex Fluor 488 (green) analyzed by a confocal fluorescence microscope. Mitotracker Red-stained mitochondria and DAPI-stained nuclei were identified by red and blue fluorescence respectively. (B) Twenty micorgrams of total proteins from various cell lines were electrophoresed through a denaturing polyacrylamide gel, electroblotted, and hybridized with cytochrome c antibody with β-actin as a loading control. (C) Quantification of cytochrome c levels. The levels of cytochrome c in control and mutant cell lines were determined as described elsewhere (53). The calculations were based on three independent determinations in each cell line. (D) Twenty micrograms of total proteins from various cell lines were electrophoresed through a denaturing polyacrylamide gel, electroblotted, and hybridized with cleaved PARP, Caspases 3, 7 and 9 antibodies with β-actin as a loading control. (E) Quantification of four apoptosis-activated proteins. The levels of Caspases 9, 3, 7 and PARP in various cell lines were determined as described elsewhere (52). The calculations were based on three independent determinations in each cell line. Graph details and symbols are explained in the legend to Figure 3.

