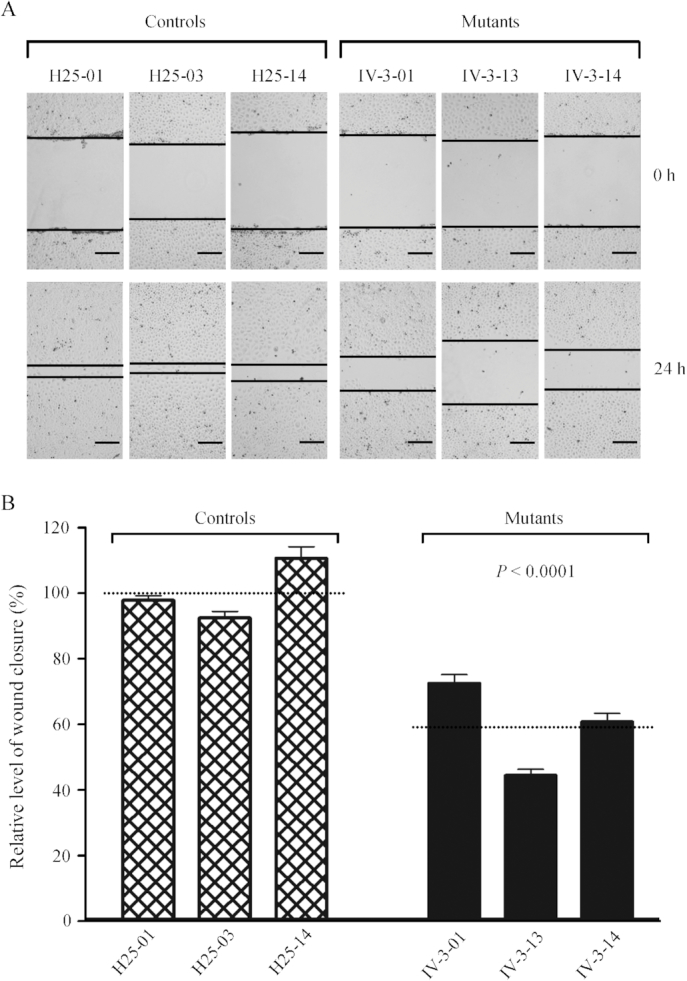
Figure 11.

Wound healing assay. (A) Representative images of wound healing assay for three control and three mutant cybrid cell lines. Photographs were taken directly immediately after scratch and 24 h after wounding. The outlines show the gap area of the wounds. Scale bars, 100 μm. (B) Quantification of wound healing rates. Quantitative measurement of cell migration was performed at 24 h after wounding as described elsewhere (53). The calculations were based on 3–4 independent determinations in each cell line. Graph details and symbols are explained in the legend to Figure 3.
