Figure 12.
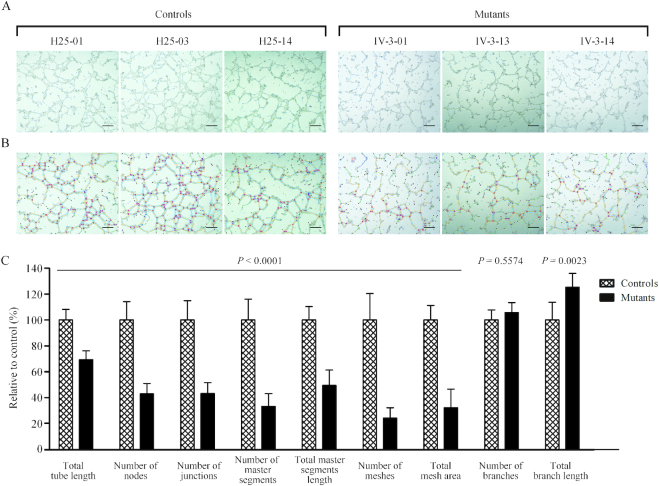
Tube formation Assay. Cells (1 × 10⁵) from three control and three mutant cybrids cells were grown and resuspended with medium and loaded on top of Matrigel. Following incubation at 37°C for 12 h, each well was analyzed directly for tube formation under an inverted microscope. (A) Representative light photomicrographs of tube formation for three control cybrids and three mutant cybrids after plating onto Matrigel for 16 h. (B) The photomicrographs were analyzed using Angiogenesis Analyzer (ImageJ), different structures of the tubule network are labeled with different colors representing its own feature: master segments (orange), meshes (sky blue), nodes surrounded by junction symbol (red surrounded by blue) and branches (green). (C) Quantitative analysis of specific parameters of capillary tube formation with the Angiogenesis Analyzer for ImageJ. The parameters include total tube length, number of nodes, number of junctions, number of master segments, total master segments length, number of meshs, total mesh area, number of branches and total branch length. Data represent an average of nine fields of each cell line. Scale bars, 500μm. Graph details and symbols are explained in the legend to Figure 3.

