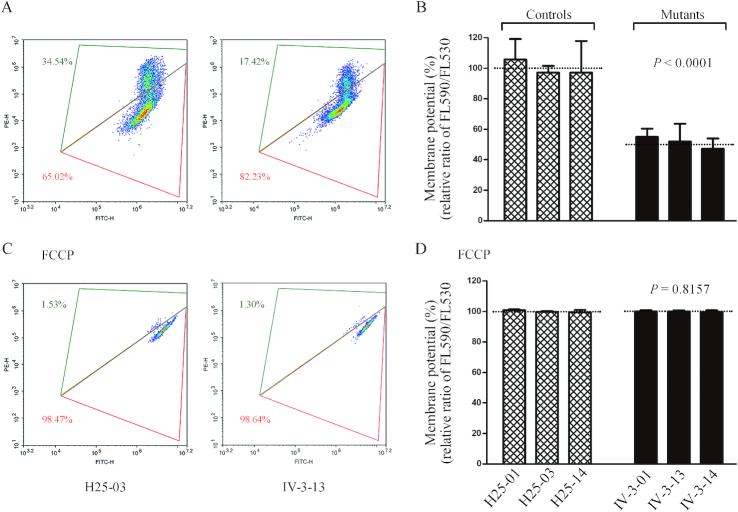
Figure 8.
Mitochondrial membrane potential analysis. The mitochondrial membrane potential (ΔΨm) was measured in mutant and control cybrid cell lines by BD-LSR II flow cytometer system using a fluorescence probe JC-10 assay system. The ratio of the Ex/Em = 488/590 nm and 488/525 nm fluorescence intensities (FL590/FL525) was recorded to determine the ΔΨm level of each sample. Flow cytometry images of H25-03 and IV-3-13 without (A) and with (C) FCCP. Relative ratio of JC-10 fluorescence intensities at Ex/Em = 490/530 nm and 490/590 nm in (B) absence and (D) presence of 10 μM of FCCP. Graph details and symbols are explained in the legend to Figure 3.

