Figure 2.
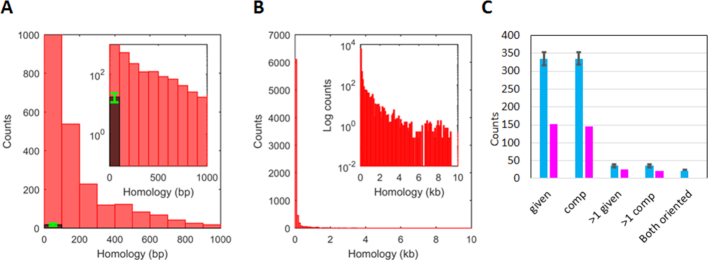
Statistical distributions from bacterial genomes showing repeats >20 bp and distributions of Chi sites or randomly positioned markers in repeats >20 bp. (A) The red bars in the histogram represent repeats with length between 20 and 1000 bp averaged over the four E. coli genomes using a 100 bp bin width. The dark bar shows an analogous result obtained for 100 5-Mbp sequences composed of randomly chosen bases. The green error bar shows the standard deviation for those 100 sequences. (B) Same as A), but including all repeat lengths. (C) The magenta bars show the total number of Chi sites positioned within repeats summed over 12 enteric bacteria, whereas the cyan bars show the results for the same sequences when random markers are positioned in the sequence. The error bars correspond to the results for 100 realizations of the randomly placed markers. Importantly, for each genome the number of markers is the same as the number of Chi sites. The label below each pair of bars indicates the strand to which the results apply. The given strand is the strand whose sequence is given in the sequence database, and the comp strand is the strand that is complementary to that sequence. Thus, the first two pairs of bars correspond to the number of repeats that contain at least one Chi site on the given and comp strands, respectively. Similarly, the second two pairs of bars indicate the number of repeats that contain more than one Chi site on the given and comp strands, respectively. The final cyan bar shows the number of repeats that would contain properly oriented Chi sites on both strands. The corresponding magenta bar is zero.

