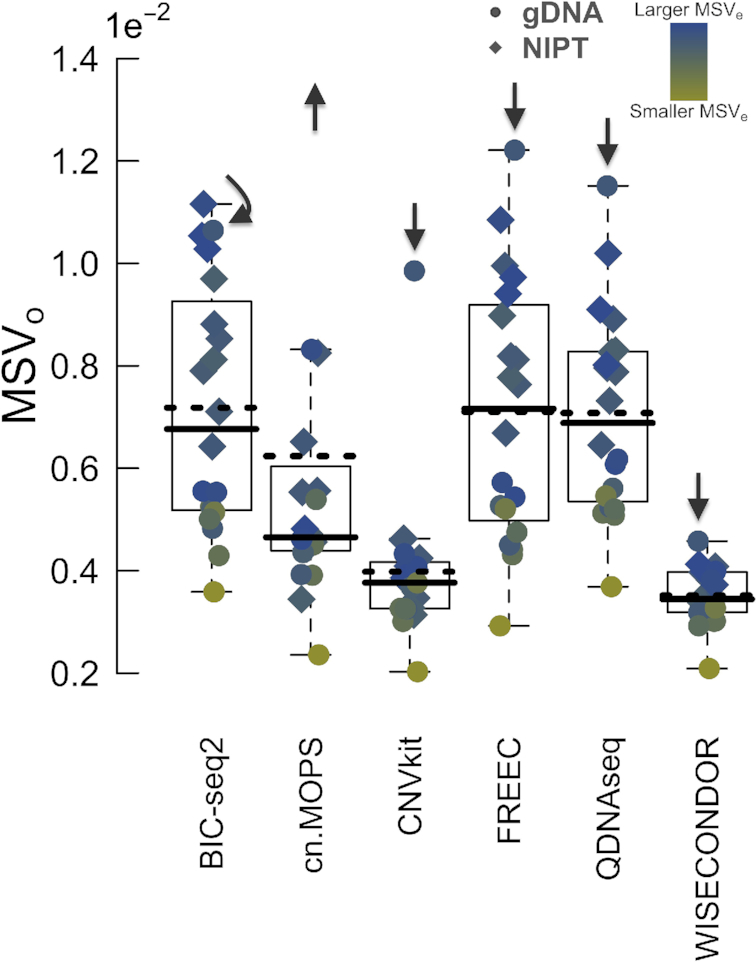
Figure 2.

The median segment variance. Scattered dots represent sample-wise observations of median segment variances (MSVo). The default boxplots clarify the underlying distributions. A solid line represents the median, whereas a dotted line indicates the mean. Note that the means are consistently higher than the medians, caused by outlier sample gDNA-3 (Supplementary Figure S8), which is additionally marked by arrows. The colors of the dots represent the MSVe, a measure that depends on bin size and sequencing depth. According to the outlier sample, the lowest mean and median MSVo and a generally smooth blue-to-yellow (MSVe) transition, WISECONDOR scores best.
