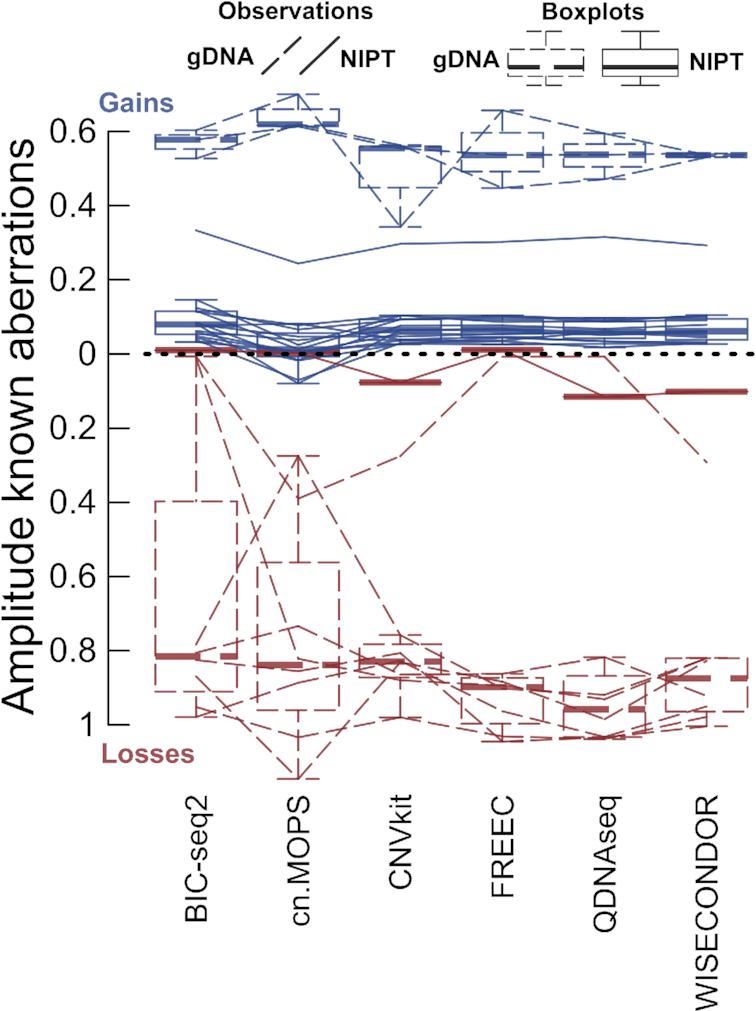
Figure 3.

The amplitude of aberrations. Traveling left-to-right lines symbolize specific confirmed events (Supplementary Table S3) and their interpretation by the tools. The default boxplots clarify the underlying distributions. Solid lines (both for boxplots and observations) represent NIPT, whereas gDNA is depicted by dotted lines. For NIPT, one sample appears with elevated amplitudes, which concerns a mosaic maternal variation (NIPT-22). The narrowest event (in gDNA-11) is exclusively captured by cn.MOPS, CNVkit and WISECONDOR.
