Figure 1.

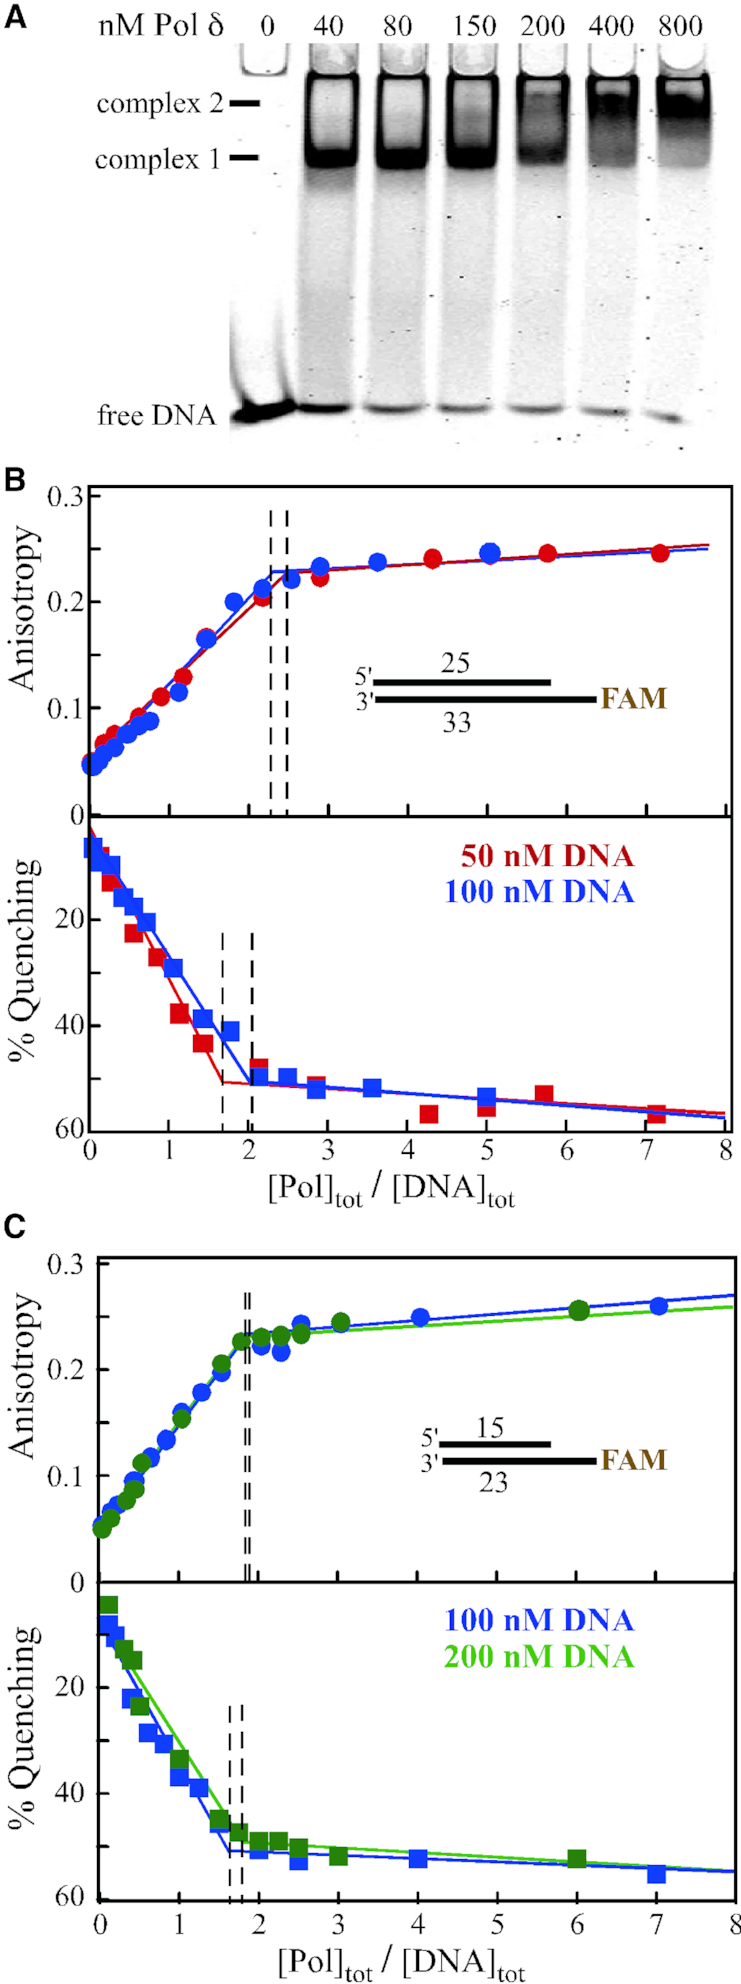
DNA binding studies of Pol δ. (A) Electrophoretic mobility shift assay. 25 nM 33/25 template/primer DNA was incubated with increasing concentrations of mini-Pol δ-DV at 100 mM NaCl. Complexes were resolved on a 5% native polyacrylamide gel (see Materials and Methods). Complex 1 and 2 appear successively at increasing polymerase concentrations. (B, C) Fluorescence anisotropy and fluorescence quenching studies. The indicated template/primers (33/25 in (B) and 23/15 in (C)) were mixed with increasing concentrations of mini-Pol δ-DV at 40 mM NaCl. In (B) 50 nM DNA in red, 100 nM DNA in blue; in (C) 100 nM DNA in blue, 200 nM DNA in green. The data points are fitted to a two-segment fit analysis (using Origin software). Vertical dotted lines were drawn from the intersection points.
