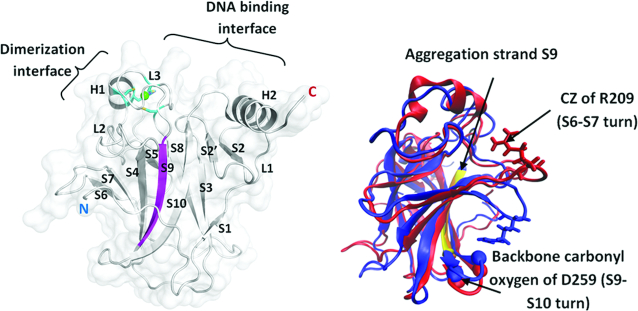
Figure 1.
DNA binding domain (DBD) with secondary structures labeled (PDB ID- 2XWR_A). Green sphere represents Zn and the residues (Cys176(SG), Cys238(SG), Cys242(SG) and His 179(ND1)) coordinated to Zn are shown in sticks. The aggregation prone region in p53 DBD is present in strand S9 and is colored in magenta. The N and C termini of the domain are labeled. Figure on right shows dominant conformational states of the S6–S7 turn in p53 DBD. WT (blue) and V143A (red) DBD from MD simulations (at 310 K) superimposed to highlight differential conformational sampling of the S6–S7 turn in these two forms of the domain. Atoms, which are labeled on the S6–S7 turn and S9–S10 turn, are used to quantify the conformational sampling of this turn by measuring the distance between them. WT DBD samples a ‘closed’ state whereas V143A DBD samples an ‘open’ state of the S6–S7 turn.

