Figure 2.
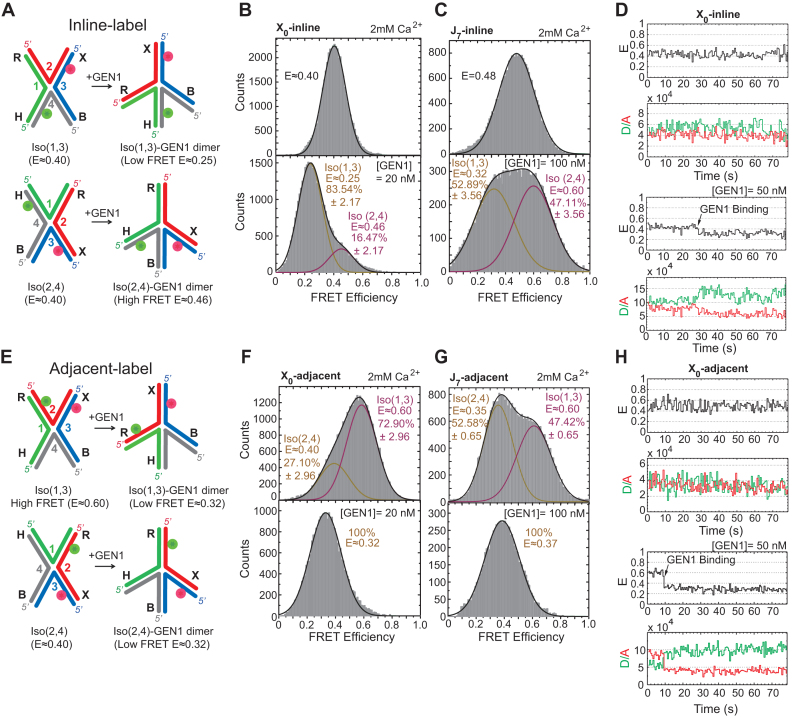
Active distortion of the HJ by GEN1 (A) Inline-label schematic of the HJ structural distortion by GEN1 based on the proposed model (36). (B) FRET histogram of inline-label X0 showing a single peak (E ≈ 0.40). At saturating GEN1 concentration, the major low FRET peak (E ≈ 0.25) is attributed to GEN1-Iso(1,3) while the minor high FRET peak (E ≈ 0.46) results from GEN1-Iso(2,4). (C) FRET histogram of J7 showing a single peak (E ≈ 0.48). GEN1 binding to Iso(1,3) and Iso(2,4) yields two nearly equal populations of low and high FRET isomers, respectively. (D) Upper panel: FRET time trace of inline-label X0. Lower panel: GEN1 is flown in Ca2+ buffer to detect the onset of binding. A stable complex persists throughout the acquisition time. (E) GEN1 binding to adjacent-label Iso(1,3) and Iso(2,4) forms a low FRET structure (E ≈ 0.32). (F) FRET histogram of X0 exhibits a major high FRET peak (E ≈ 0.60) corresponding to Iso(1,3) and a lower FRET peak (E ≈ 0.40) for Iso(2,4). At saturating GEN1 concentration, the whole histogram is transformed into a single low FRET peak. (G) FRET histogram of J7 exhibits two nearly equal populations at high and low FRET corresponding to Iso(1,3) and Iso(2,4), respectively. Binding of GEN1 forms a low FRET structure corresponding to a single peak (E ≈ 0.37). (H) Upper panel: FRET time trace of adjacent-label X0. Lower panel: GEN1 binding forms a stable low FRET state (E ≈ 0.32). The uncertainties in panels B, C, F, G represent the standard deviations from two or more experiments.

