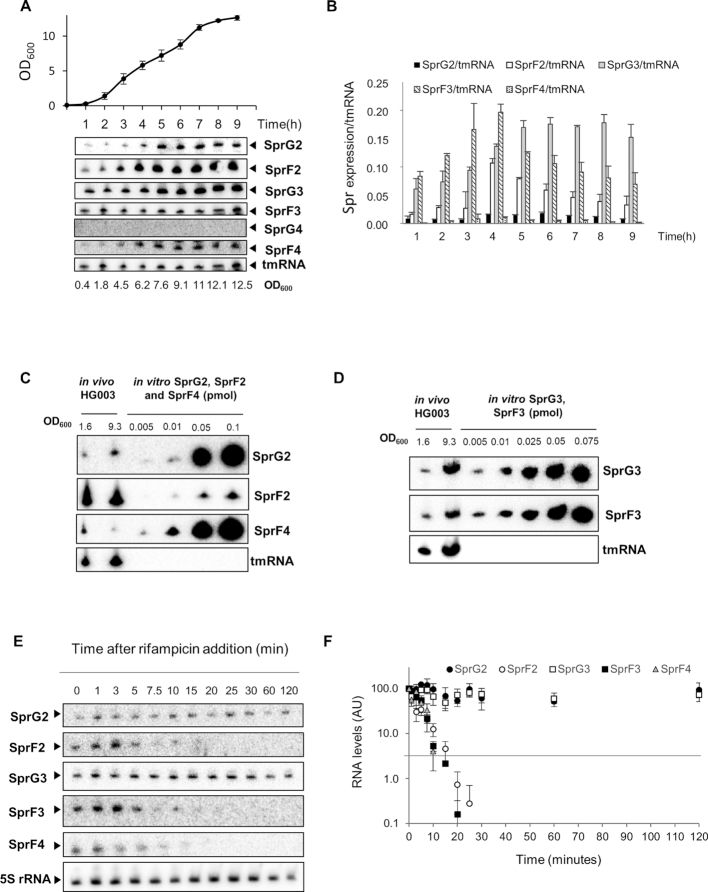
Figure 3.
SprG2, SprG3, SprF2, SprF3 and SprF4 RNA expression survey, quantities, and stabilities in Staphylococcus aureus HG003. (A) Growth kinetics in liquid cultures of S. aureus HG003, and northern blots detecting SprG2, SprF2, SprG3, SprF3, SprG4 and SprF4 RNA at various times during growth, with tmRNA as the internal control. (B) SprF2, SprG2, SprF3, SprG3 and SprF4 RNA quantifications during S. aureus HG003 growth relative to tmRNA. (C) RNA quantifications of SprG2, SprF2, and SprF4 and (D) SprG3 and SprF3 relative to a range of increasing amounts of synthetic SprG2, SprF2, SprF4, SprG3 and SprF3 RNA. In vivo samples were taken during exponential (OD600 = 1.6) and stationary (OD600 = 9.3) growth phases. (E) SprG2, SprF2, SprG3, SprF3 and SprF4 expression levels during growth after rifampicin addition, relative to the 5S rRNA control. (F) Quantification of the RNA levels of SprG2 (black circles), SprF2 (white circles), SprG3 (white squares), SprF3 (black squares) and SprF4 (gray triangles) after rifampicin addition. AU, arbitrary units. The error bars in B and F indicate variations between three biological replicates.

