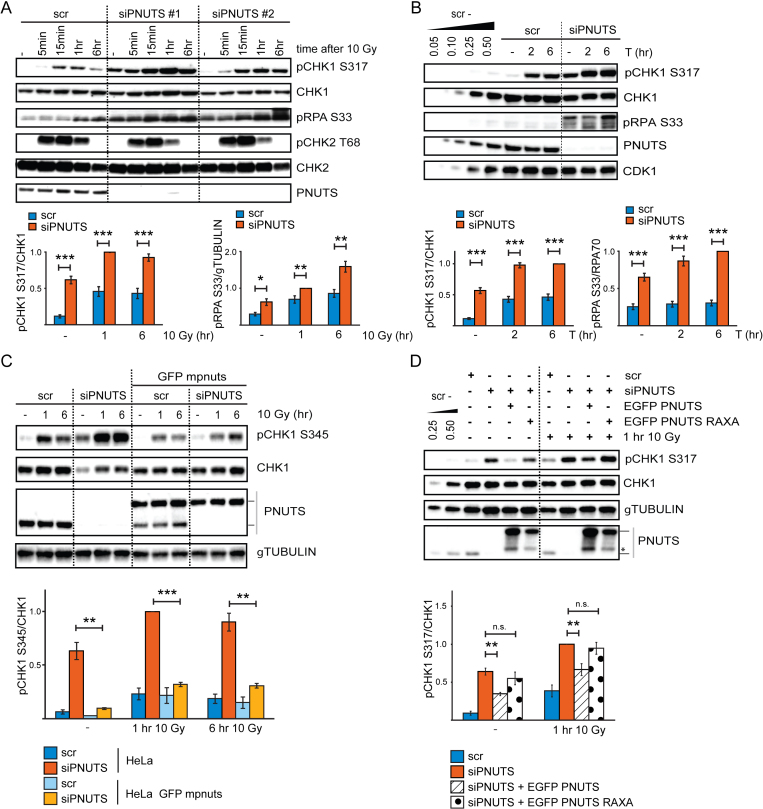
Figure 1.
PNUTS-PP1 suppresses ATR signaling. (A) Western blot analysis of ATR and ATM signaling events in control scrambled siRNA transfected (scr) or PNUTS siRNA transfected (siPNUTS #1 and siPNUTS #2) HeLa cells, without IR or at indicated times after 10 Gy. Cells were harvested at 72 h after siRNA transfection. Bottom bar charts show quantification of pCHK1 S317 relative to CHK1 and pRPA S33 relative to γTUBULIN levels for siPNUTS #2, hereafter called siPNUTS (n = 8). (B) Western blot analysis of untreated cells or at 2 or 6 h after addition of thymidine to cells siRNA transfected as in A) (scr and siPNUTS). Bottom bar charts show quantification of pCHK1 S317 relative to CHK1 and pRPA S33 relative to RPA70 levels (n = 10). (C) Western blot analysis of HeLa cells or HeLa BAC clones stably expressing EGFP mouse pnuts (mpnuts) transfected with scr or siPNUTS (specifically targets human PNUTS), without IR or at 1 or 6 h after 10 Gy. Lines to the right of the western blot indicate migration of human endogenous PNUTS (lower band) and EGFP mpnuts (upper band). Bottom bar chart shows quantification of pCHK1 S345 relative to CHK1 levels (n = 3). (D) Western blot analysis of HeLa cells transfected with scr or siPNUTS. At 24 h post transfection, the indicated samples were transfected with wild type EGFP PNUTS or PP1-binding deficient EGFP PNUTS RAXA. Cells were harvested 48 h later without further treatment (–) or 1 h after 10 Gy. Lines to the right of the western blot indicate migration of endogenous PNUTS (lower band) and EGFP PNUTS/EGFP PNUTS RAXA (upper band), asterisk indicates what is likely EGFP PNUTS/EGFP PNUTS RAXA degradation products. Bar chart shows quantification of pCHK1 S317 relative to CHK1 (n = 3). Error bars indicate standard error of the mean (SEM) and statistical significance was calculated by the two-tailed Student's two sample t-test. *P < 0.05, **P < 0.01, ***P < 0.001

