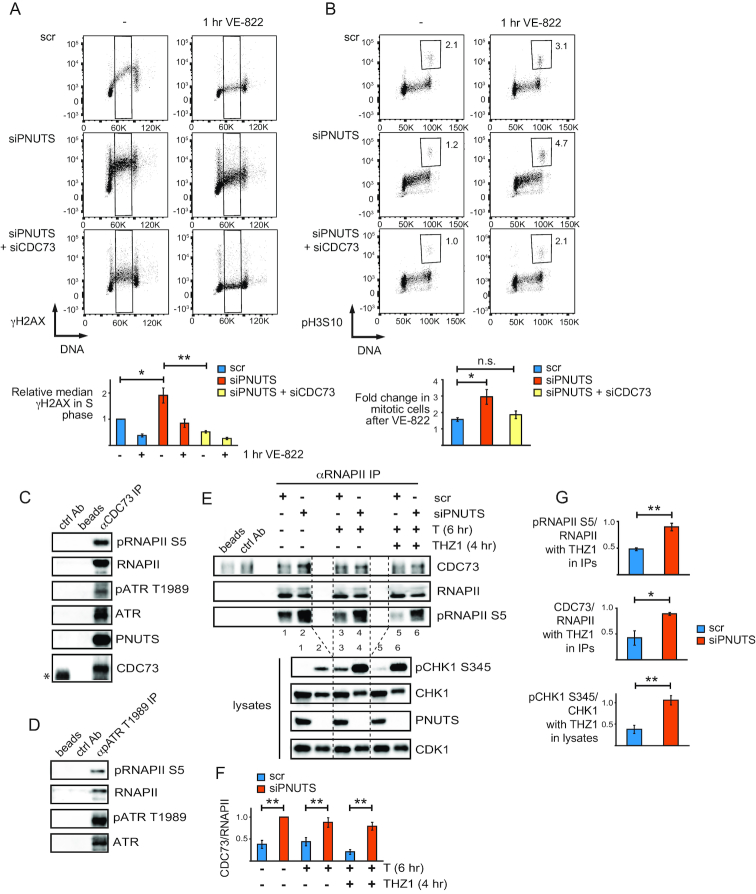
Figure 6.
CDC73 is required for high ATR signaling in S-phase and activation of the endogenous G2 checkpoint after PNUTS depletion, and interacts with ATR and RNAPII. (A) Flow cytometry charts showing γH2AX staining versus DNA content as in 3A) of scr, siPNUTS or siPNUTS and siCDC73 transfected cells harvested at 72 h after siRNA transfection with and without 1 h treatment with VE-822. Quantifications show relative median γH2AX levels in indicated S-phase cells (black box). (n = 3) *P < 0.05, **P < 0.001 based on two-tailed two sample Student's t-test. (B) Flow cytometry charts showing phosphohistone H3 Ser 10 (pH3S10) staining versus DNA content of cells treated as in 6A). Mitotic cells were selected based on DNA content and high pH3S10 staining as indicated. Numbers indicate percentages of mitotic cells. Quantifications show fold increase in mitotic cells after 1h VE-822 for each siRNA condition. *P < 0.05, based on two-tailed two sample Student's t-test. (C) Western blot analysis of immunoprecipitations from HeLa cell lysates, using a control antibody (ctrl Ab), no antibody (beads) or anti-CDC73 antibodies (αCDC73 IP). *Indicates IgG band from the control antibody, which migrated slightly faster than CDC73 in the western blot. (D) Western blot analysis of immunoprecipitations as in C), but using anti-pATR T1989 antibodies (αpATR T1989 IP). (E) Western blot analysis of immunoprecipitations as in (C), but using RNAPII antibodies recognizing both the phosphorylated and the non-phosphorylated RNAPII (αRNAPII IP). Immunoprecipitations were performed on lysates from scr and siPNUTS transfected cells harvested at 72 h after siRNA transfection, with and without thymidine for 6 h and THZ1 for 4 h. Upper western blot shows immunoprecipitations, and lower blot shows corresponding lysates. (F) Bar chart showing quantifications from three independent experiments performed such as E, of CDC73 relative to RNAPII in western blots from RNAPII immunoprecipitations. (G) Bar charts showing fold changes of THZ1 and thymidine treated samples relative to samples treated with thymidine alone for respective siRNA oligonucleotides from quantifications of western blots from three independent experiments performed such as (E). pRNAPII S5 relative to RNAPII and CDC73 relative to RNAPII values were from the immunoprecipitations, and pCHK1 S345/CHK1 values were from the corresponding lysates. For quantifications of CDC73 from immunoprecipitations, background (value of band in beads alone), was substracted during the quantifications. *P < 0.05, **P < 0.01 based on the two-tailed Student's two sample t-test. Error bars represent SEM.

