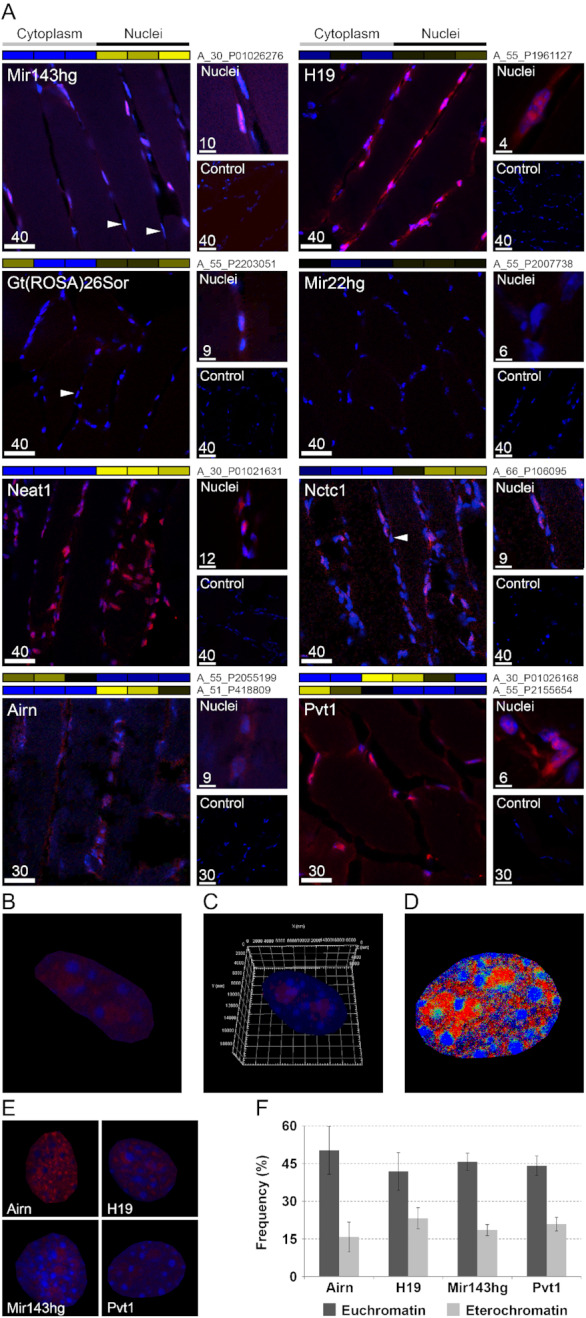
Figure 2.

FISH of lncRNAs. (A) FISH on TA slices for selected lncRNAs. Labeled antisense strands of lncRNA probes were used as controls. Heat maps associated to each FISH images represent the results of genome wide analysis of lncRNA subcellular localization in TA myofibers. Names of microarray probes are listed near the heat map, where two names are present, it means that two different probes identified the same lncRNA in the microarray. Labels ‘Cytoplasm’ and ‘Nuclei’ indicate the cellular compartment where the signal of the probe was measured (blue = low expression; yellow = high expression). Arrows indicate examples of nuclei in the same myofiber that respond differently for the staining of some lncRNAs. Scale bar lengths are expressed in μm. (B) Enlarged FISH image of myonucleus positive for Pvt1 probe. (C) 3D reconstruction of a nucleus labeled for Pvt1 (red) and with DAPI (blue) (see also Supplemental Video S1). (D) Co-localization map. Pixels were colored in red where Pvt1 showed high expression, in blue when DAPI produced strong staining and in green when both had high staining. Co-localization (green) is underrepresented compared to individual Pvt1 or DAPI staining indicating that Pvt1 localizes in euchromatic regions. (E) Example of nuclei positively responding to probes for the lncRNAs Airn, H19, Mir143hg and Pvt1. (F) Frequency of high staining for lncRNA (red) in association with chromatin state (blue intensity). Chromatin state can be evidenced by DAPI staining. Dense areas of condensed chromatin (heterochromatin) correspond to DAPI-brighter regions. Airn, H19, Mir143hg and Pvt1 prevalently localized in euchromatic regions. Standard deviation was calculated on ∼20 nuclei per lncRNA.
