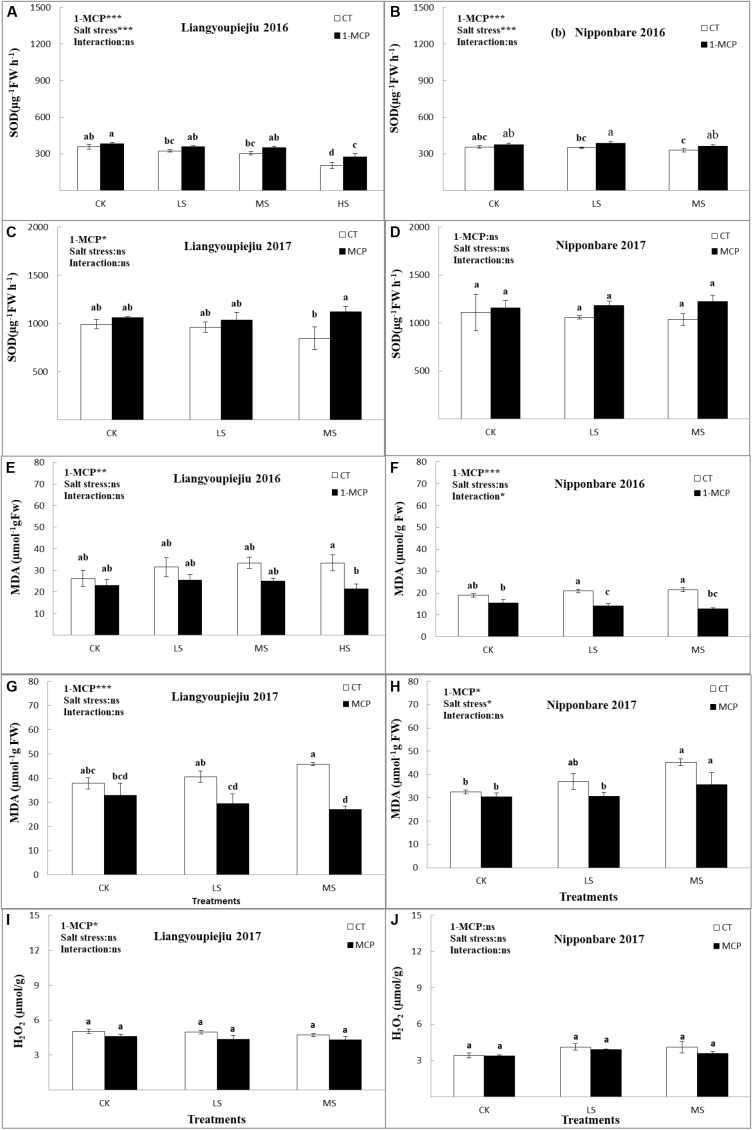
FIGURE 4.
Comparison effects of 1-MCP and salt levels on SOD (A–D), MDA (E–H), and H2O2 (I,J) of rice flag leaf in 2016 and 2017. Values are denoted as mean ± SE (n = 4). Values followed by different letters are significantly different (p ≤ 0.05) according to LSD test. Where treatments are Control (CK), Low Salt Stress (LS), and Medium Salt Stress (MS), while CT = no 1-MCP treatment and 1-MCP = 1-MCP treatment. Liangyoupeijiu (LYP9) and Nipponbare (NPBA) are rice cultivars. P-values of the two-way ANOVAs of 1-MCP, salt stress, and their interaction are indicated: ns, not significant; ∗P < 0.05; ∗∗P < 0.01; ∗∗∗P < 0.001. Bars with the same letter are not significantly different by LSD test.

