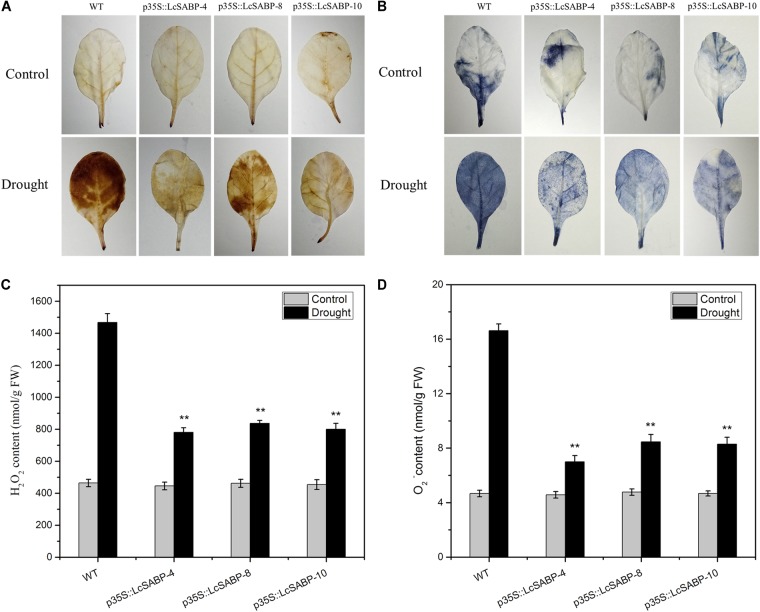
FIGURE 7.
Changes in H2O2 (A,C) and O2- (B,D) levels in WT and transgenic plants subjected to drought stress. Drought-stressed leaves were incubated in diaminobenzidine (DAB) or nitroblue tetrazolium (NBT) solution. Brown staining indicates H2O2 accumulation (A). Blue staining indicates the location and levels of O2-(B). H2O2 content (C) and O2- content (D) were measured after drought treatment. The labels under the graphs correspond to the plant materials shown in (A,B). Control, plants grown under normal conditions; drought, plants grown under drought stress treatment (14 days); WT, wild type. The transgenic lines were named by the construct names followed by the line number: p35S::LcSABP-4 refers to p35S::LcSABP line 4; p35S::LcSABP-8 refers to p35S::LcSABP line 8; p35S::LcSABP-10 refers to p35S::LcSABP line 10. Bars represent the mean ± SE of three independent experiments. ∗∗Significantly different at the P < 0.01 level compared to WT.

