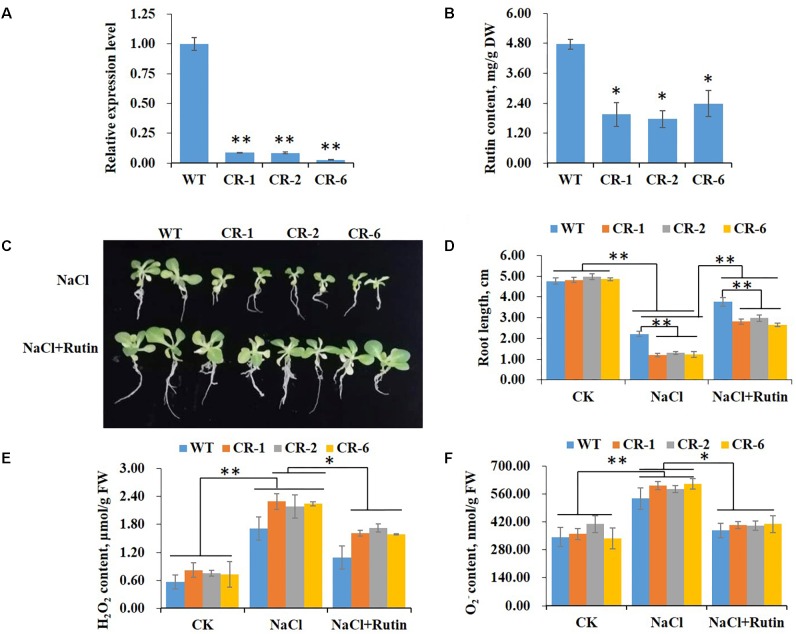
FIGURE 6.
NtCHS1 RNAi silenced transgenic plants show a similar phenotype to NtMYB4 overexpressing transgenic plants in salt stress. (A) The expression level of NtCHS1 decreased in RNAi silenced T0 transgenic tobacco leaves compared to WT. Asterisks in (A) indicate remarkable difference (∗∗P < 0.01) between NtCHS1 RNAi transgenic lines and WT. (B) Rutin content decreased in NtCHS1 RNAi silenced transgenic tobacco lines compared to WT. DW, dry weight. Asterisks in (B) indicate remarkable difference (∗P < 0.05) between NtCHS1 RNAi transgenic lines and WT. (C,D) Root length of WT and NtCHS1 RNAi transgenic plants treated with salt stress with or without exogenous rutin. Values in (D) that are significantly different between treatments and among lines within each treatment are marked with ∗∗P < 0.01 and ∗P < 0.05. (E,F) H2O2 or content of WT plants and NtCHS1 RNAi silenced transgenic lines under control (CK) and salt treatment (NaCl) with or without rutin supplementation, measured by visible spectrophotometry. FW, fresh weight. Data are expressed as the mean ± SD as determined from three independent biological replicates. Values in (E,F) that are significantly different between treatments and among lines within each treatment are marked with ∗∗P < 0.01 and ∗P < 0.05.

