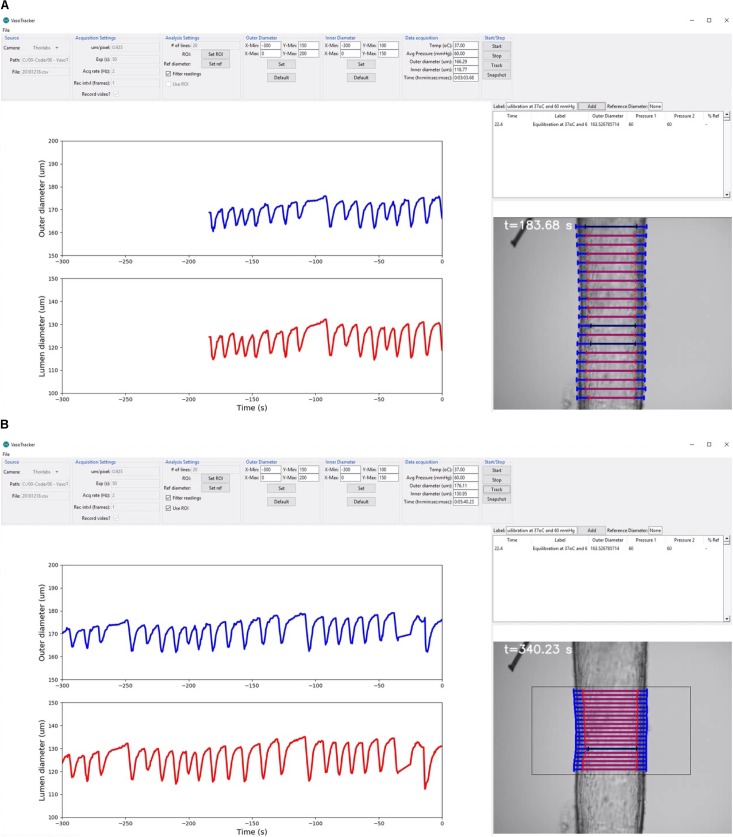
FIGURE 4.
VasoTracker software. (A,B) Views of the VasoTracker graphical user interface during an experiment in which a posterior cerebral artery (from a male rat) developed spontaneous vasomotion at 60 mmHg. (A) Shows outer diameter (blue lines) and inner diameter (red lines) measurements determined for 20 scan lines spaced vertically along the longitudinal axis of the artery. (B) Shows the same artery at a later time point after the diameter measurement has been restricted to a user-defined region of interest. In these examples, the graphs show average diameter measurements for the most recently acquired 300-s period, with the most recently acquired data point shown at t = 0 s (i.e., the data moves to the left as new data is acquired). Outlier diameter measurements are detected using the modified z-score, are excluded from the average diameter calculation, and are overlaid in black on the image display. The full dataset from which these screenshots were taken is shown in Supplementary Video S1.

