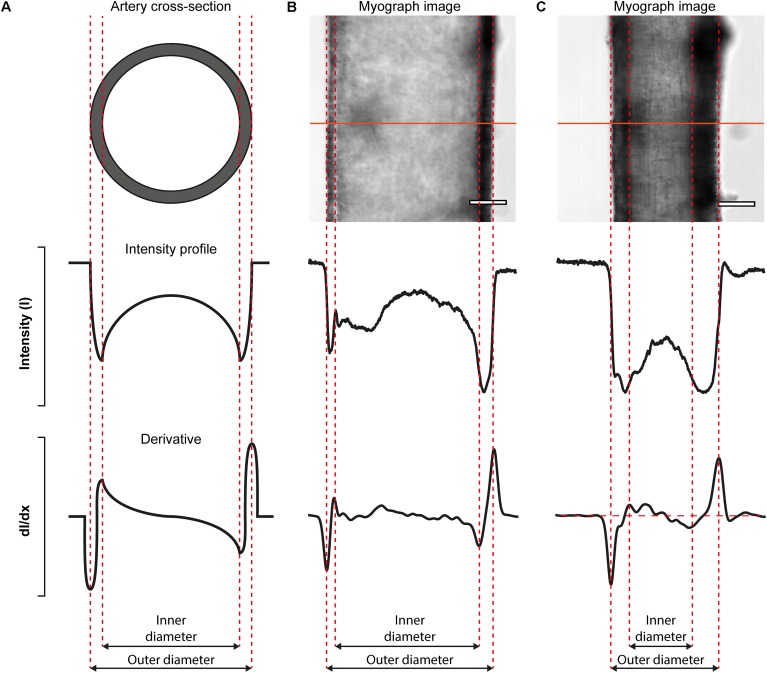
FIGURE 5.
Algorithmic determination of inner and out diameter of pressurized blood vessels. (A) Schematic diagram (cross-sectional view, top) of an artery, idealized intensity profile (middle), and the first derivative of the idealized intensity profile (bottom) illustrating how peaks in the derivative profile may be used to identify the edges of an artery. (B,C) Real-data examples illustrating the algorithm. The top panels show a first-order mesenteric artery (male rat), pressurized to 80 mmHg, in the absence (B) and presence (C) of the α-adrenergic agonist, phenylephrine (1 μM). Scale bars = 100 μm.

