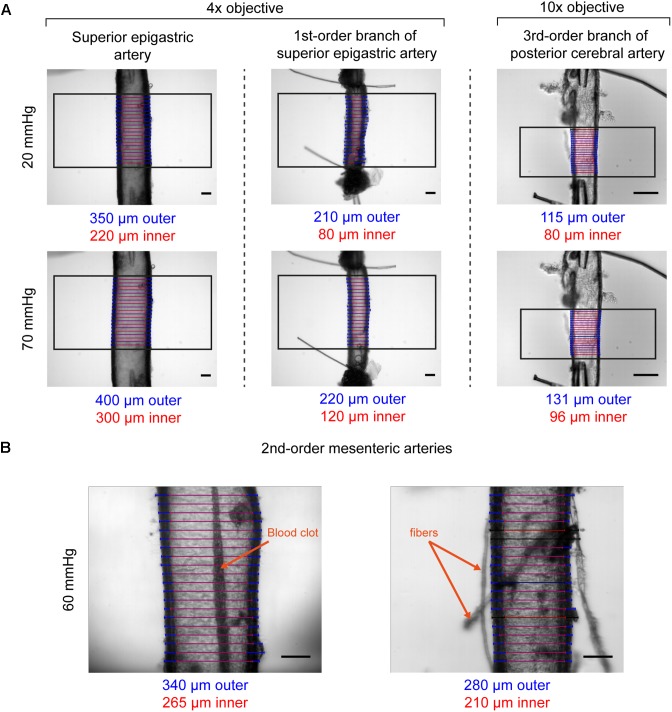
FIGURE 6.
Examples of VasoTracker diameter detection. (A) Example images showing outer and inner diameter tracking in the superior epigastric artery, a first-order branch of the superior epigastric artery, and a third-order branch of the posterior cerebral artery. Each artery (obtained from male rats) was exposed to 20 mmHg and 70 mmHg intraluminal pressure, and the diameter tracking algorithm was confined to a region of interest (black box). Blue/red scan lines indicate outer and inner diameter measurements, respectively. Outliers are colored black. (B) Example images showing diameter tracking in second-order mesenteric arteries (from male rats) pressurized to 60 mmHg imaged under sub-optimal conditions. The artery shown on the left has a blood clot in the middle of the lumen which could not be flushed out. The artery on the right has numerous fibers and other debris attached to the adventitia. Despite the condition of these arteries, in both examples VasoTracker is quite capable of accurately tracking the vessel wall. All image scale bars = 100 μm.

