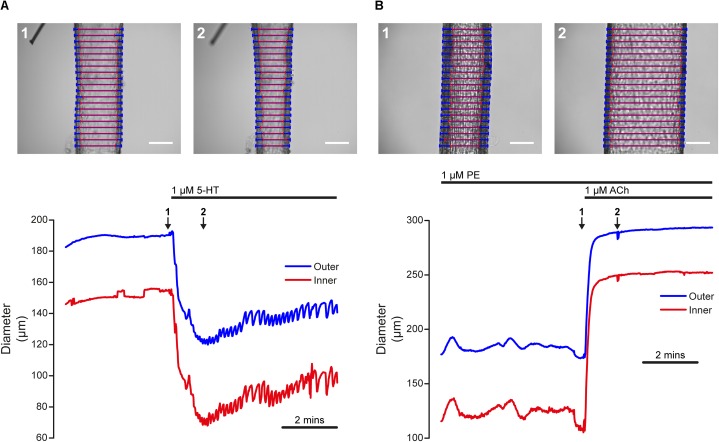
FIGURE 7.
Dynamic tracking of artery diameter during agonist-evoked contraction and relaxation. (A) Time-course of contraction of a posterior cerebral artery (60 mmHg) in response to 5-HT (1 μM). The top panels show the artery before (1) and after (2) the application of 5-HT. The lower panel shows the diameter measured by VasoTracker (average of 20 line-scans). Outer (blue) and inner (red) diameter are shown. The time points corresponding to the images shown in the upper panel are indicated by the numbered arrows. (B) Time-course of dilation of a pre-contracted (PE, 1 μM) second-order mesenteric artery (60 mmHg) to ACh (1 μM). Images show the artery before (top, 1) and after (top, 2) the application of ACh (1 μM). Again, the bottom panel shows average artery diameters (outer and inner, 20 line-scans) measured by VasoTracker for the full experiment. Both arteries obtained from male rats. Scale bars = 100 μm.

