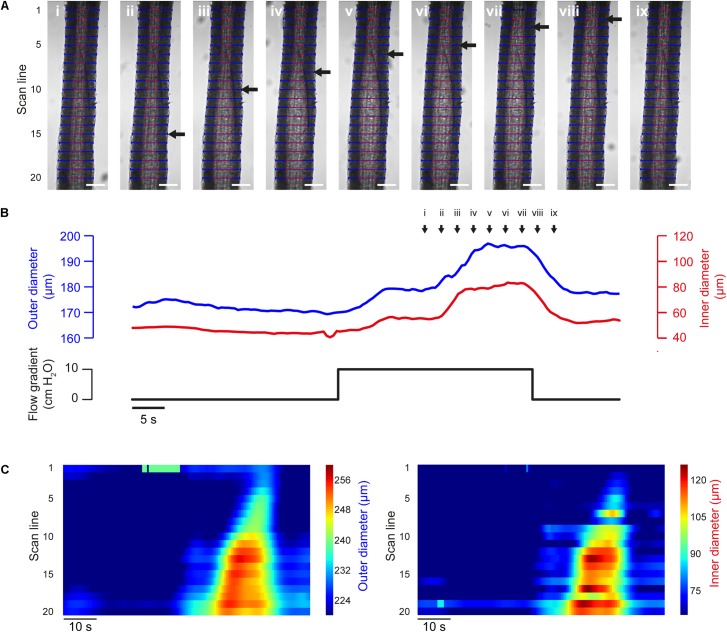
FIGURE 9.
Flow-induced propagated vasodilation (A) Images of a pre-contracted (PE, 500 nM) third-order rat mesenteric artery (male rat) at nine time points during an experiment in which dilation was initiated by intraluminal flow (∼100 μl/min, established by a 10 cm H2O pressure gradient across the vessel). After an initial partial dilation, another dilation occurred. The second dilation propagated along the length of the artery (wave front indicated by black arrow). Blue and red lines indicate VasoTracker measurements of outer and inner vessel diameter, respectively. Scale bars = 100 μm. (B) Traces showing average outer and inner diameter measurements (top) and the pressure gradient (bottom) for the experiment shown in (A). (C) Heat plots showing diameter (color) plotted against time (x-axis) for each of the scan lines (y-axis) shown in (A). The propagated nature of the vasodilation is evident in the contours of the heat plot.

