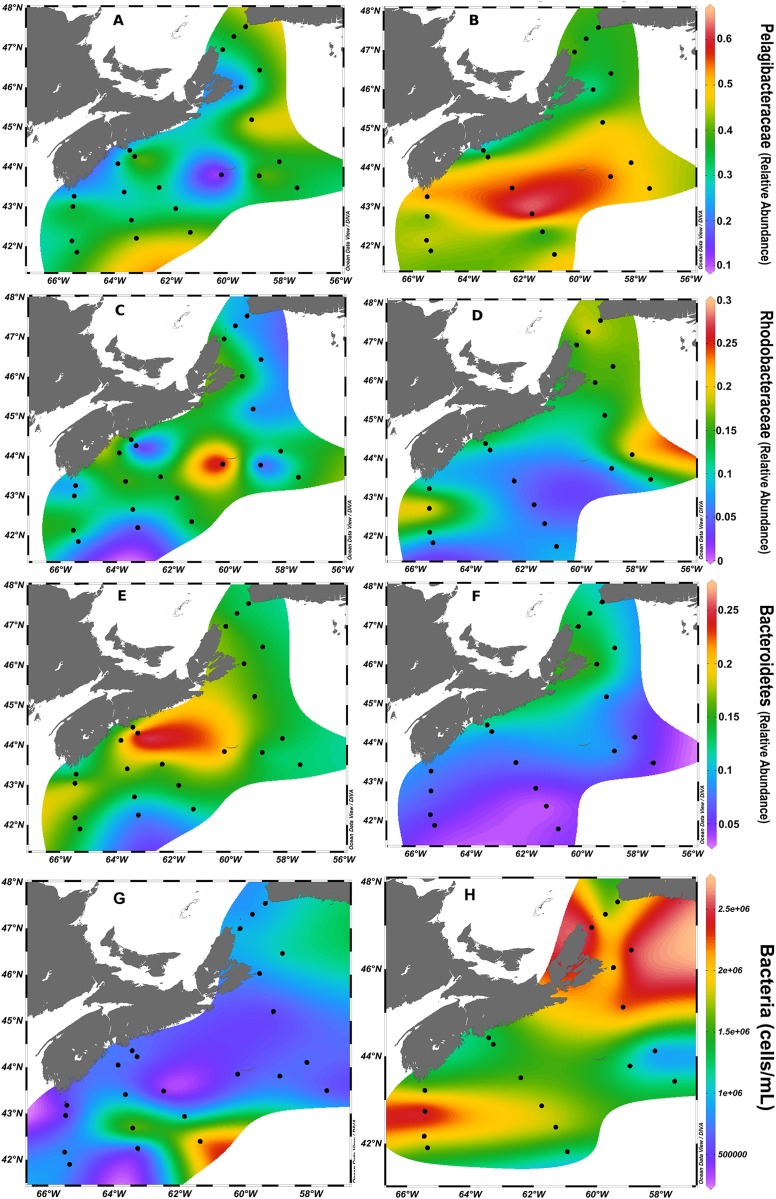
FIGURE 5.
Surface plots, from the 1 m depth, of taxa over the SS in spring (A,C,E,G) and fall (B,D,F,H). Pelagibacteraceae (A,B), Rhodobacteraceae (C,D), and Bacteroidetes (E,F) groups are displayed. Note that color scales are fixed between seasons of the same taxa, but vary between taxa. Black dots mark surface sites. (G,H) Represent the bacterial cell density in spring and fall, respectively. Bacterial cell density was overall correlated with temperature and was higher in the fall (Supplementary Figure S4).

