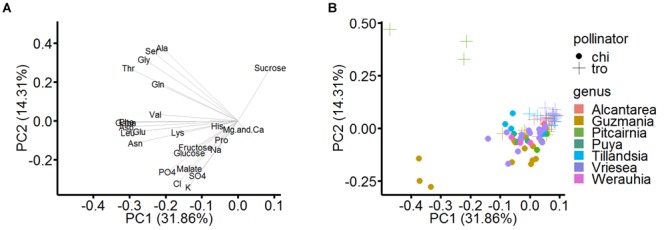
FIGURE 5.

Loadings and scatterplot of PCA in rotated space (pollinator and taxonomic groups). In the PCA, the statistically analyzed samples were selected according to their pollinator and their taxonomic groups (genera). (A) Loading plot, which illustrate the original variables loaded as vectors in PCA space. The first principal component (PC 1) describes 31.9% and the second principal component (PC 2) describes 14.3% of the dataset variation. (B) Scatterplot of PCA, in which the data are grouped by pollinator (markings) and genus (colors).
